官方文档
官方文档链接(看完之后的感觉是我懂了,但没完全懂。)
具体使用
业务需求
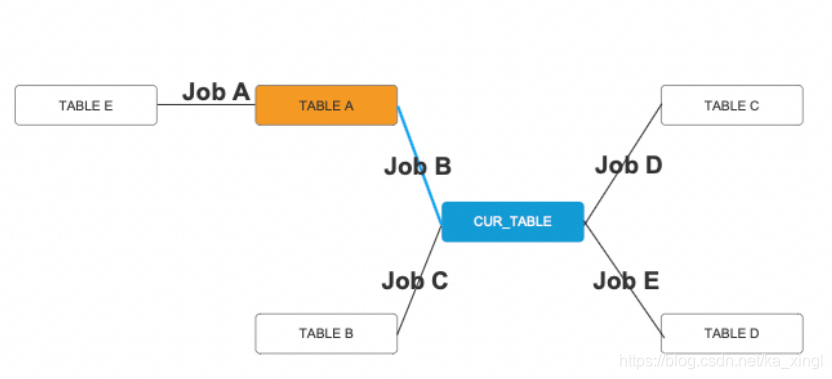
- 做数据血缘,大概类似做ER图吧,一开始想使用echarts拓扑图来做,但是echarts有个定位问题一直没弄明白,找不到办法解决,echarts的节点需要自定义位置,但是我们是动态数据,且力引导算法不满足业务需求,所以最后选择了antv g6。
主要问题
1、需要自定义节点,g6使用自定义dom节点满足改需求,但是根据文档提供,dom节点无法使用g6提供的点击事件。

- 通过配置节点type,使节点指向某自定义节点。
// 当前节点高亮 通过type匹配自定义节点
if (this.data.nodes[i].highLight == 1) {
	this.data.nodes[i].type = 'center'
} else {
	this.data.nodes[i].type = 'dom-node'
}
- 自定义dom节点
G6.registerNode(
	'dom-node', {
		draw: (cfg, group) => {
			// console.log(cfg, group)
			const shape = group.addShape('dom', {
				attrs: {
					width: cfg.size[0],
					height: cfg.size[1],
					// 传入 DOM 的 html
					html: `
					<div onclick="select(${cfg.name})" id="${cfg.select}" class="dom-node-style" style="cursor:pointer; border-radius: 5px; width: ${
					  cfg.size[0] - 5
					}px; height: ${cfg.size[1] - 5}px; display: flex;">

					  <span style="margin:auto; padding:auto; color: #000">${cfg.id}</span>
					</div> `,
				},

				draggable: true,
			});
			return shape;
		},
	},
	'single-node',
);
// 当前表节点
G6.registerNode(
	'center', {
		draw: (cfg, group) => {
			// console.log(cfg)
			const shape = group.addShape('dom', {
				attrs: {
					width: cfg.size[0],
					height: cfg.size[1],
					// 传入 DOM 的 html   ${cfg.isActive ? "class='selected-style'" : "class='node-style'"}"
					html: `
						<div onclick="select(${cfg.name})" id="${cfg.select}" class="node-style" style="width: ${
						  cfg.size[0] - 5
						}px; height: ${cfg.size[1] - 5}px; display: flex;border-radius: 5px;cursor:pointer;">
						  <span style="margin:auto; padding:auto; color: #000">${cfg.id}</span>
						</div> `,
				},

				draggable: true,
			});
			return shape;
		},

	},
	'single-node',
);
2、调整状态样式,点击节点或线时改变样式。
- 默认线可直接配置。具体可查看文档
defaultEdge: {
	style: {
		endArrow: true,
		lineWidth: 2,
		stroke: '#CED4D9',
		fill: "#CED4D9",
	},
},
edgeStateStyles: {
	click: {
		lineWidth: 2,
		stroke: '#5394ef',
		fill: "#5394ef",
	},
},
// 边点击事件
graph.on('edge:click', (e) => {
	// 先将所有当前是 click 状态的边置为非 click 状态
	const clickEdges = graph.findAllByState('edge', 'click');
	clickEdges.forEach((ce) => {
		graph.setItemState(ce, 'click', false);
	});
	const item = e.item; // 获取鼠标进入的边元素对象
	const jobId = item._cfg.model.jobId
	graph.setItemState(item, 'click', true); // 设置当前边的 click 状态为 true
	that.getLineInfo(jobId)
});
- 自定义dom节点需要动态改变class属性来改变样式,暂未发现更好的解决办法,欢迎交流!
// 节点点击事件
let that = this;
window.select = function(id) {
	const clickEdges = graph.findAllByState('edge', 'click');
	clickEdges.forEach((ce) => {
		graph.setItemState(ce, 'click', false);
	});
	that.getNodeInfo(id)
	var divId = 'temp' + id
	// 获取当前选中div 点击后该div替换选中样式 其他所有div恢复未选中样式
	var selectId = document.getElementById(divId)
	for (let i in that.data.nodes) {
		if (that.data.nodes[i].name == id) {
			// if (that.data.nodes[i].isActive == false) {
				selectId.setAttribute('class', 'selected-style')
				that.data.nodes[i].isActive = true
			// }
		} else {
			let tempId = document.getElementById('temp' + that.data.nodes[i].name)
			if (that.data.nodes[i].type == 'dom-node') {
				tempId.setAttribute('class', 'dom-node-style')
			} else {
				tempId.setAttribute('class', 'node-style')
			}
			that.data.nodes[i].isActive = false
		}
	}
}
3、如何销毁画布?
- 在每次请求数据之前判断,如果已经有数据则销毁画布。
// 避免多次渲染数据 销毁画布
if (this.chart !== '') {
	this.chart.destroy()
}
- 在渲染g6前赋值
this.chart = graph
4、交互模式使用,default 模式中包含点击选中节点行为和拖拽画布行为,该行为触发时会重新渲染画布导致自定义dom节点设置的状态样式取消。(自定义dom节点写在draw中,改变dom节点的状态样式如选中后变色等,是通过动态改变class属性实现的),该问题目前没有解决。
5、布局问题,g6也使用自定义节点位置,但是提供了dagre层次布局,该算法可满足需求。
layout: {
	type: 'dagre', //层次布局
	rankdir: 'LR', // 可选,默认为图的中心
	align: 'DL', // 可选
	nodesep: 25, // 可选
	ranksep: 25, // 可选
	controlPoints: true, // 可选
},
完整代码
<script>
    //引入g6
	import G6 from '@antv/g6';
	import {
		getGraphData,
		getLineInfo,
		getNodeInfo
	} from '@/api/home/assetCatalogueDetail'
	export default {
		data() {
			return {
				id: 0,
				type:0,//0-全部血缘,1-直系父子,2-所有父表,3-所有子表
				activeName:'first',
				chart: '',
				visible: true,
				nodeList: [],
				lineList: [],
				data: {
					// 点集
					nodes: [],
					// 边集
					edges: [],
				}
			}
		},
		methods: {
			init(id) {
				this.id = id
				this.getData()
			},
			getData() {
				// 避免多次渲染数据 销毁画布
				if (this.chart !== '') {
					this.chart.destroy()
				}
				this.getNodeInfo(this.id)
				getGraphData(Object.assign({
					basicDataId:this.id,
					relationType: this.type
				})).then(response => {
					this.data.nodes = response.data.data.node
					this.data.edges = response.data.data.line
					// console.log(this.data)
					for (let i in this.data.nodes) {
						// g6 id代表节点名称
						let name = this.data.nodes[i].name
						let id = this.data.nodes[i].id
						this.data.nodes[i].id = name
						this.data.nodes[i].name = id
						// 设置节点的连接点 anchorPoint 指的是边连入节点的相对位置,即节点与其相关边的交点位置
						this.data.nodes[i].anchorPoints = [
							[0.5, 0],
							[1, 0.5],
							[0, 0.5],
							[0.5, 1],
						]
						this.data.nodes[i].select = 'temp' + id
						this.data.nodes[i].isActive = false
						this.data.nodes[i].size = [120, 40]
						// 当前节点高亮 通过type匹配自定义节点
						if (this.data.nodes[i].highLight == 1) {
							this.data.nodes[i].type = 'center'
						} else {
							this.data.nodes[i].type = 'dom-node'
						}
					}

					this.renderView()
				})
			},
			renderView() {
				G6.registerNode(
					'dom-node', {
						draw: (cfg, group) => {
							// console.log(cfg, group)
							const shape = group.addShape('dom', {
								attrs: {
									width: cfg.size[0],
									height: cfg.size[1],
									// 传入 DOM 的 html
									html: `
									<div onclick="select(${cfg.name})" id="${cfg.select}" class="dom-node-style" style="cursor:pointer; border-radius: 5px; width: ${
									  cfg.size[0] - 5
									}px; height: ${cfg.size[1] - 5}px; display: flex;">

									  <span style="margin:auto; padding:auto; color: #000">${cfg.id}</span>
									</div> `,
								},

								draggable: true,
							});
							return shape;
						},
					},
					'single-node',
				);
				// 当前表节点
				G6.registerNode(
					'center', {
						draw: (cfg, group) => {
							// console.log(cfg)
							const shape = group.addShape('dom', {
								attrs: {
									width: cfg.size[0],
									height: cfg.size[1],
									// 传入 DOM 的 html   ${cfg.isActive ? "class='selected-style'" : "class='node-style'"}"
									html: `
										<div onclick="select(${cfg.name})" id="${cfg.select}" class="node-style" style="width: ${
										  cfg.size[0] - 5
										}px; height: ${cfg.size[1] - 5}px; display: flex;border-radius: 5px;cursor:pointer;">
										  <span style="margin:auto; padding:auto; color: #000">${cfg.id}</span>
										</div> `,
								},

								draggable: true,
							});
							return shape;
						},

					},
					'single-node',
				);

				const graph = new G6.Graph({
					renderer: 'svg', //使用 Dom node 的时候需要使用 svg 的渲染形势
					container: 'mountNode',
					width: 800,
					height: 500,
					layout: {
						type: 'dagre', //层次布局
						rankdir: 'LR', // 可选,默认为图的中心
						align: 'DL', // 可选
						nodesep: 25, // 可选
						ranksep: 25, // 可选
						controlPoints: true, // 可选
					},
					defaultEdge: {
						style: {
							endArrow: true,
							lineWidth: 2,
							stroke: '#CED4D9',
							fill: "#CED4D9",
							// cursor:'pointer'
						},
					},
					edgeStateStyles: {
						click: {
							lineWidth: 2,
							stroke: '#5394ef',
							fill: "#5394ef",
						},
					},
					modes: {
						default: [
							// 'drag-canvas', //拖拽画布
							// 'zoom-canvas', //缩放画布
						]
					},
					fitCenter: true, //平移图到中心将对齐到画布中心,但不缩放

				});
				// 节点点击事件
				let that = this;
				window.select = function(id) {
					const clickEdges = graph.findAllByState('edge', 'click');
					clickEdges.forEach((ce) => {
						graph.setItemState(ce, 'click', false);
					});
					that.getNodeInfo(id)
					var divId = 'temp' + id
					// 获取当前选中div 点击后该div替换选中样式 其他所有div恢复未选中样式
					var selectId = document.getElementById(divId)
					for (let i in that.data.nodes) {
						if (that.data.nodes[i].name == id) {
							// if (that.data.nodes[i].isActive == false) {
								selectId.setAttribute('class', 'selected-style')
								that.data.nodes[i].isActive = true
							// }
						} else {
							let tempId = document.getElementById('temp' + that.data.nodes[i].name)
							if (that.data.nodes[i].type == 'dom-node') {
								tempId.setAttribute('class', 'dom-node-style')
							} else {
								tempId.setAttribute('class', 'node-style')
							}
							that.data.nodes[i].isActive = false
						}
					}
				}
				// 边点击事件
				graph.on('edge:click', (e) => {
					// 先将所有当前是 click 状态的边置为非 click 状态
					const clickEdges = graph.findAllByState('edge', 'click');
					clickEdges.forEach((ce) => {
						graph.setItemState(ce, 'click', false);
					});
					const item = e.item; // 获取鼠标进入的边元素对象
					const jobId = item._cfg.model.jobId
					graph.setItemState(item, 'click', true); // 设置当前边的 click 状态为 true
					that.getLineInfo(jobId)
				});
				this.chart = graph
				graph.data(this.data); // 读取 Step 2 中的数据源到图上
				graph.render(); // 渲染图
				// graph.fitView();
			},
			getNodeInfo(value) {
				this.visible = true
				getNodeInfo(Object.assign({
					id: value,
					curId: this.id
				})).then(response => {
					this.nodeList = response.data.data
					// console.log(this.nodeList)
				})
			},
			getLineInfo(value) {
				this.visible = false
				getLineInfo(value).then(response => {
					this.lineList = response.data.data
					// console.log(this.lineList)
				})
			},

		}
	}
</script>

<style>
	.node-style {
		background-color: #fff;
		border: 1px solid #5B8FF9;
	}

	.selected-style {
		background-color: orange;
	}

	.dom-node-style {
		background-color: #fff;
		border: 1px solid #000;
	}
</style>