本博文源于高等数学用python实现,包含了变量与函数,如何利用python进行基本数学运算,也包含了如何利用python绘制平面曲线,效果非常不错,可方便收藏,代码+效果,简短而高效,可方便修改,也可随手复制。
文章目录
- 实验一:变量与函数
- 实验二: 利用python进行基本数学运算
-
- 1.直接输入并计算 ( 1.5 ) 3 − 1 3 sin π + 5 (1.5)^3-\frac{1}{3}\sin{\pi}+\sqrt{5} (1.5)3−31sinπ+5
- 2.设球的半径为r=2,求球的体积 V = 4 3 π r 3 V=\frac{4}{3}\pi{r^3} V=34πr3
- 3. 求 y 1 = 2 s i n ( 0.3 π ) 1 + 5 , y 2 = 2 c o s ( 0.3 π ) 1 + 5 y_1=\frac{2sin(0.3\pi)}{1+\sqrt{5}},y_2=\frac{2cos(0.3\pi)}{1+\sqrt{5}} y1=1+52sin(0.3π),y2=1+52cos(0.3π)
- 实验三:利用Python绘制平面曲线
实验一:变量与函数
1.将0.182赋值给x,将0.225赋值给y
>>> x,y = 0.182,'hello'
>>> x
0.182
>>> y
'hello'
>>>
2.调用math标准库,计算 sin π 2 \sin{\frac{\pi}{2}} sin2π
>>> import math
>>> math.sin(math.pi/2)
1.0
>>>
3.自定义函数,返回用户输入实数的绝对值
>>> def main():
...     a = input("Enter a number:")
...     print(fabs(float(a)))
...
>>> main()
Enter a number:23
23.0
>>> main()
Enter a number:-12
12.0
>>>
实验二: 利用python进行基本数学运算
1.直接输入并计算 ( 1.5 ) 3 − 1 3 sin π + 5 (1.5)^3-\frac{1}{3}\sin{\pi}+\sqrt{5} (1.5)3−31sinπ+5
>>> from math import sin,sqrt,pi
>>> 1.5**3-sin(pi)/3+sqrt(5)
5.61106797749979
>>>
2.设球的半径为r=2,求球的体积 V = 4 3 π r 3 V=\frac{4}{3}\pi{r^3} V=34πr3
>>> from math import pi
>>> r = 2
>>> v = 4/3*pi*pow(r,3)
>>> v
33.510321638291124
>>>
3. 求 y 1 = 2 s i n ( 0.3 π ) 1 + 5 , y 2 = 2 c o s ( 0.3 π ) 1 + 5 y_1=\frac{2sin(0.3\pi)}{1+\sqrt{5}},y_2=\frac{2cos(0.3\pi)}{1+\sqrt{5}} y1=1+52sin(0.3π),y2=1+52cos(0.3π)
>>> from math import sin,cos,sqrt,pi
>>> y1 = 2 * sin(0.3*pi)/(1+sqrt(5))
>>> y2 = 2 * cos(0.3*pi)/(1+sqrt(5))
>>> print('y1=',y1,';y2=%.2f'%y2)
y1= 0.5 ;y2=0.36
>>>
实验三:利用Python绘制平面曲线
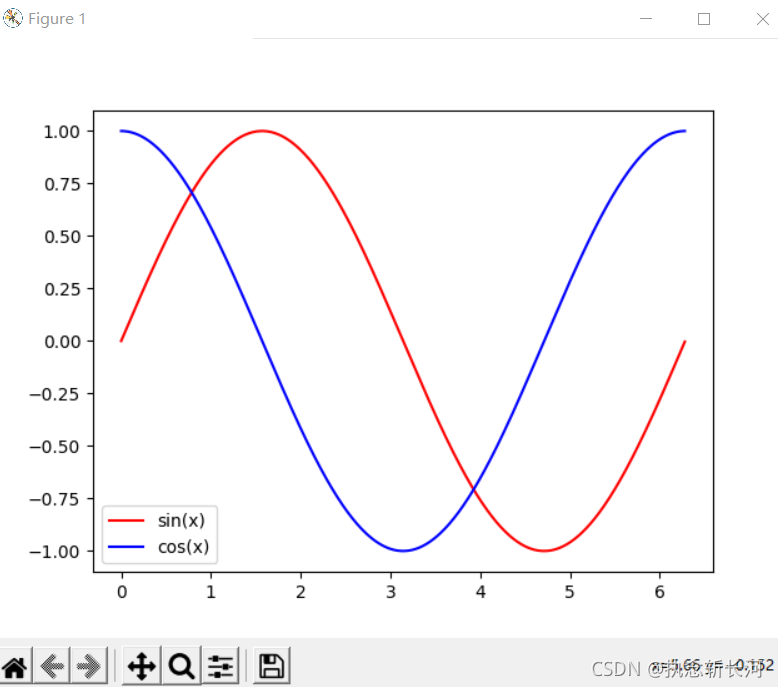
3.1 同时绘制函数y=sinx和y=cos的图像
import  matplotlib.pyplot as plt
from numpy import *
x = arange(0,2*pi,0.01)
y1 = sin(x)
y2 = cos(x)
plt.figure()
plt.plot(x,y1,color='r',linestyle='-',label='sin(x)')
plt.plot(x,y2,color='b',linestyle='-',label='cos(x)')
plt.legend()
plt.show()
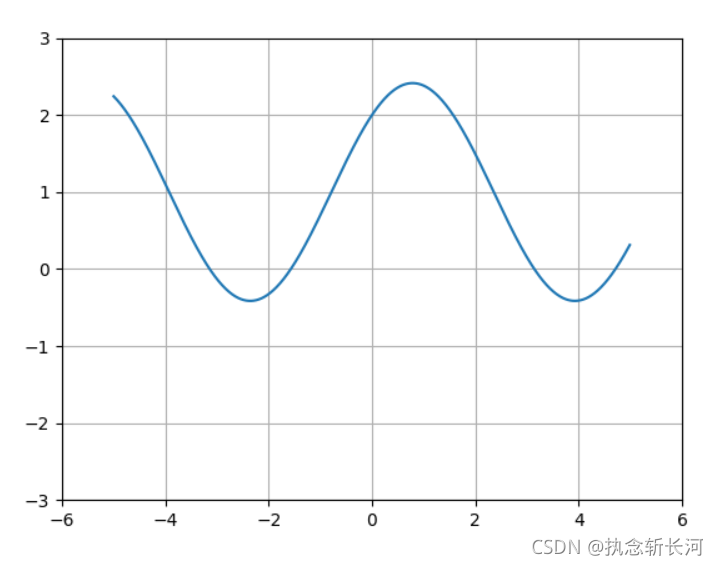
3.2 绘制以下函数的图像,判断其奇偶性,并观察其在x=0处的连续性
( 1 ) y = sin x + cos x + 1 (1)y=\sin{x}+\cos{x}+1 (1)y=sinx+cosx+1
( 2 ) y = log 2 ( x + 1 + x 2 ) (2)y=\log_2{(x+\sqrt{1+x^2})} (2)y=log2(x+1+x2)
import matplotlib.pyplot as plt
import numpy as np
x = np.arange(-5,5,0.01)
y = np.sin(x) + np.cos(x) + 1
plt.figure()
plt.plot(x,y)
plt.axis([-6,6,-3,3])
plt.grid(True)
plt.show()