Pandas 教程(下)综合练习
一、端午节的淘宝粽子交易
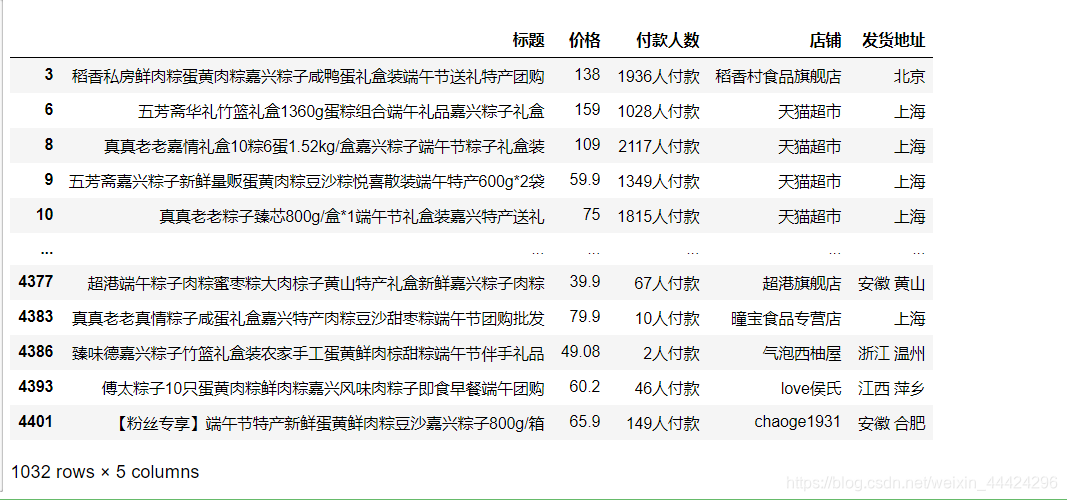
(1) 请删除最后一列为缺失值的行,并求所有在杭州发货的商品单价均值。
df_1 = pd.read_csv('../data/端午粽子数据.csv')
df_1.head()

# 结果可以看出有很多脏数据
df_1.info()
<class 'pandas.core.frame.DataFrame'>
RangeIndex: 4403 entries, 0 to 4402
Data columns (total 5 columns):
 #   Column  Non-Null Count  Dtype
---  ------  --------------  -----
 0   标题      4403 non-null   object
 1    价格     4403 non-null   object
 2   付款人数    4332 non-null   object
 3   店铺      4403 non-null   object
 4   发货地址    4400 non-null   object
dtypes: object(5)
memory usage: 172.1+ KB
df_1.columns
Index(['标题', ' 价格', '付款人数', '店铺', '发货地址 '], dtype='object')
# 去掉空格
df_1.columns = df_1.columns.str.strip()
# 去掉发货地址的缺失值
df_1.dropna(axis=0, subset=['发货地址'], inplace=True)
# 寻找脏数据
df_hz = df_1.loc[df_1['发货地址'].str.contains(r'杭州')]
df_hz.loc[~df_hz['价格'].str.match(r'^\d+\.?\d+$')]

df_hz.loc[4376, '价格'] = 45
df_hz['价格'].astype('float').mean()
80.90088888888877
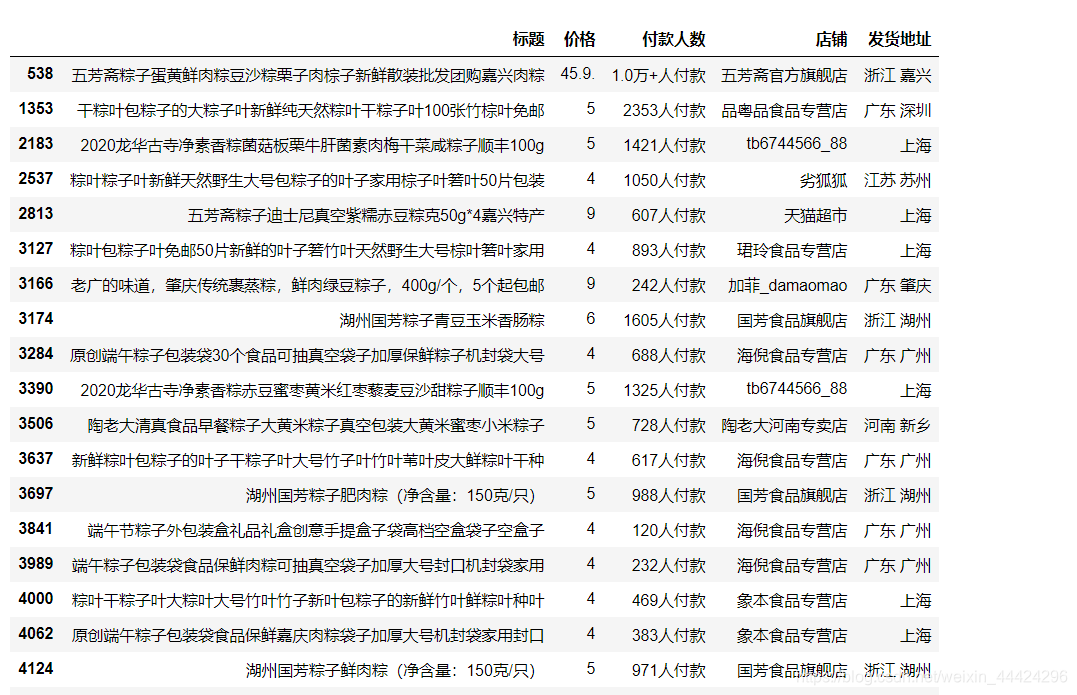
(2) 商品标题带有“嘉兴”但发货地却不在嘉兴的商品有多少条记录?
df_jx = df_1.loc[df_1['标题'].str.contains(r'嘉兴')]
df_jx.loc[~df_jx['发货地址'].str.contains(r'嘉兴')]
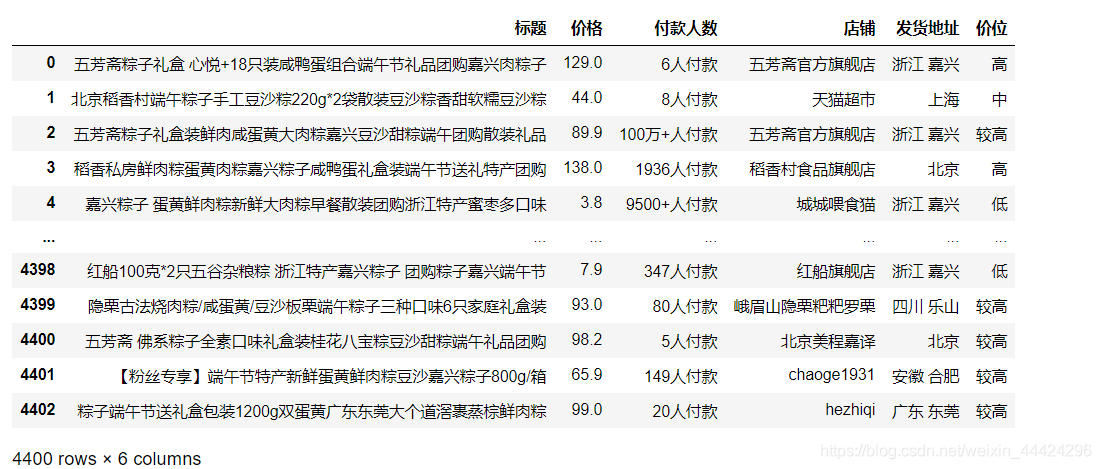
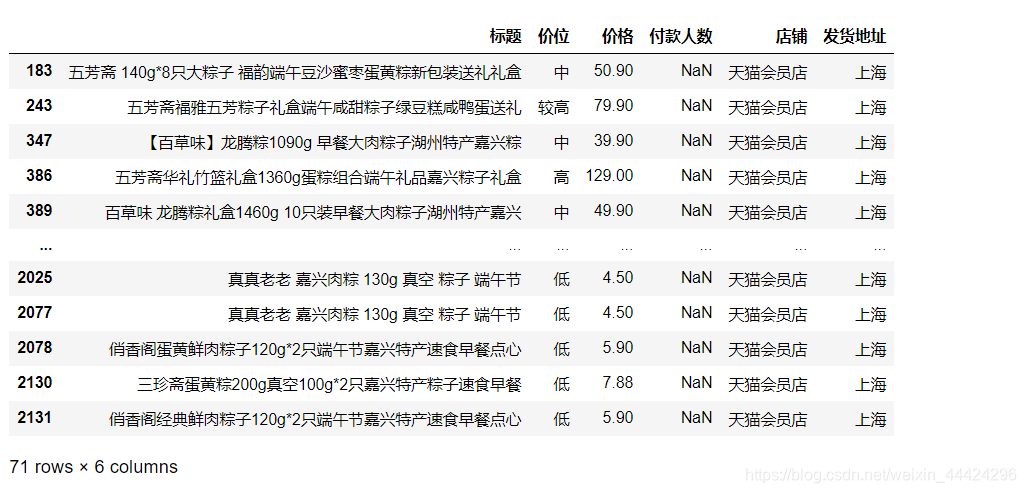
(3) 请按照分位数将价格分为“高、较高、中、较低、低”5 个类别,再将
类别结果插入到标题一列之后,最后对类别列进行降序排序。
# 找出不正常的数字
df_1.loc[~df_1['价格'].str.match(r'^\d+\.?\d+$')]
df_1.loc[[538, 4376], '价格'] = [45.9, 45]
df_1['价格'] = df_1['价格'].astype('float')
# 按照百分位数分组
df_1['价位'] = pd.cut(df_1['价格'], bins=np.percentile(df_1['价格'], [0, 20, 40, 60, 80, 100]), labels=['低', '较低', '中', '较高', '高'])
df_1
cols = list(df_1.columns)
cols.remove('价位')
cols.insert(1, '价位')
df_1 = df_1[cols]
df_1.sort_values('价位', ascending=False)

df_1.loc[df_1['价位'].isna(), '价位'] = ['低', '低']
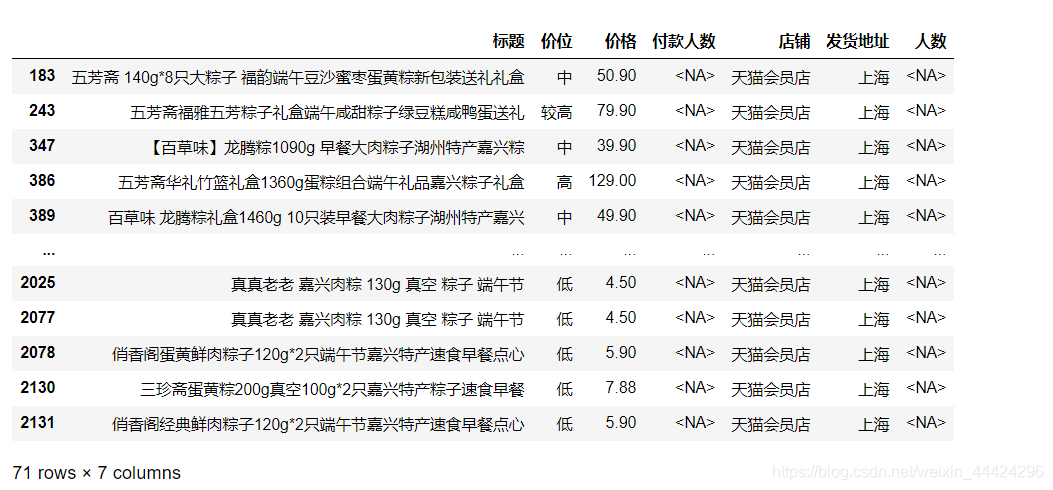
(4) 付款人数一栏有缺失值吗?若有则请利用上一问的分类结果对这些缺失
值进行合理估计并填充。
df_1.loc[df_1['付款人数'].isna()]
df_1 = df_1.convert_dtypes()
df_1['人数'] = df_1['付款人数'].str.replace(r'人付款', '')
df_1['人数'] = df_1['人数'].str.replace(r'\+', '')
df_dot = df_1.loc[df_1['人数'].str.contains(r'\.'), '人数'].str.replace('.', '')
df_dot = df_dot.str.replace('万', '000')
df_1.loc[list(df_dot.index), '人数'] = list(df_dot.values)
df_wan = df_1.loc[df_1['人数'].str.contains('万'), '人数'].str.replace('万', '0000')
df_1.loc[list(df_wan.index), '人数'] = list(df_wan.values)
df_1.loc[df_1['人数'].isna()]
# 转回float类型
df_1['人数'] = pd.to_numeric(df_1['人数'], errors='coerce')
# 进行线性插值
for _, group in df_1.groupby('价位'):
    df_1.loc[group.index, '人数'] = group[['价格', '人数']].sort_values(by='价格')['人数'].interpolate()

df_1.loc[df_1['人数'].isna()]

df_1.loc[df_1['人数'].isna(), '人数'] = [900, 900, 900]
amount = list(df_1.loc[df_1['付款人数'].isna(), '人数'])
for i in range(len(amount)):
    amount[i] = str(round(amount[i]))
person = '人付款'
for i in range(len(amount)):
    amount[i] = amount[i] + person

df_1.loc[df_1['付款人数'].isna(), '付款人数'] = amount
df_1.loc[[183, 2131]]

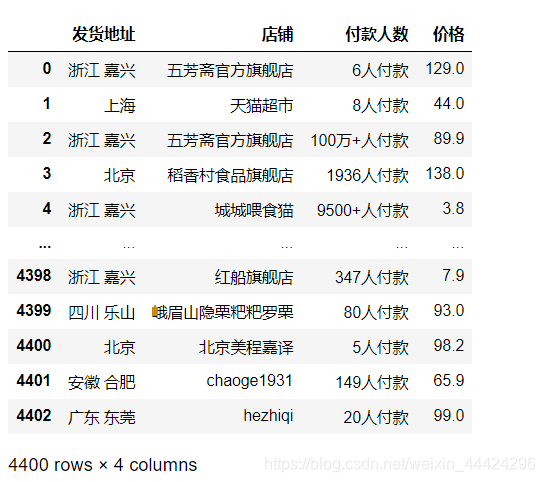
(5) 请将数据后四列合并为如下格式的 Series:商品发货地为 ××,店铺为
××,共计 ×× 人付款,单价为 ××。
df_1['价格'] = df_1['价格'].astype('str')
df_zongzi = ('商品发货地为' + df_1['发货地址'] + ',店铺为' + df_1['店铺'] + ',共计'+ df_1['付款人数'] + ',单价为' + df_1['价格'])
df_zongzi
0          商品发货地为浙江 嘉兴,店铺为五芳斋官方旗舰店,共计6人付款,单价为129.0
1                  商品发货地为上海,店铺为天猫超市,共计8人付款,单价为44.0
2       商品发货地为浙江 嘉兴,店铺为五芳斋官方旗舰店,共计100万+人付款,单价为89.9
3          商品发货地为北京,店铺为稻香村食品旗舰店,共计1936人付款,单价为138.0
4           商品发货地为浙江 嘉兴,店铺为城城喂食猫,共计9500+人付款,单价为3.8
                           ...
4398          商品发货地为浙江 嘉兴,店铺为红船旗舰店,共计347人付款,单价为7.9
4399      商品发货地为四川 乐山,店铺为峨眉山隐栗粑粑罗栗,共计80人付款,单价为93.0
4400             商品发货地为北京,店铺为北京美程嘉译,共计5人付款,单价为98.2
4401    商品发货地为安徽 合肥,店铺为chaoge1931,共计149人付款,单价为65.9
4402        商品发货地为广东 东莞,店铺为hezhiqi,共计20人付款,单价为99.0
Length: 4400, dtype: string
(6) 请将上一问中的结果恢复成原来的四列。
df_zongzi.str.extract(r'商品发货地为(?P<发货地址>\w+\s?\w+?),店铺为(?P<店铺>[\w]+),共计(?P<付款人数>\d+[万\+]*?人付款),单价为(?P<价格>\d+\.?\d+)')
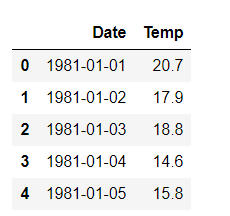
二、墨尔本每日最低温度
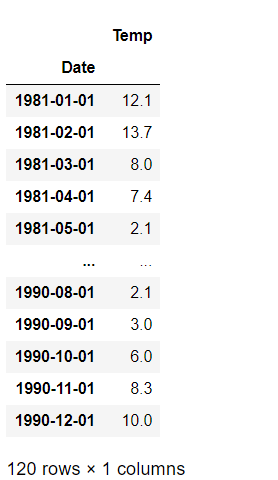
(1) 剔除国庆节、五一劳动节和每月第一个周一,求每月的平均最低气温。
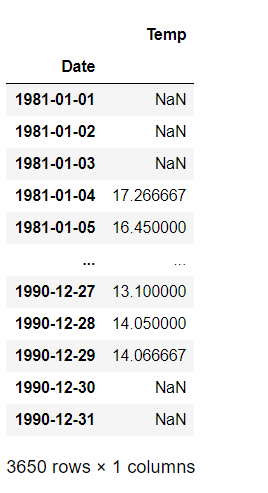
df_2 = pd.read_csv('../data/墨尔本温度数据.csv', parse_dates=['Date'])
df_2.head()
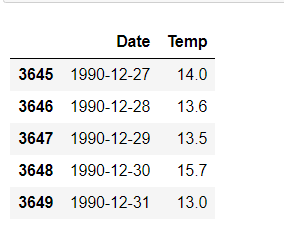
df_2.tail()
from datetime import datetime

# 记录每个月的周一
s_date = df_2.loc[df_2['Date'][df_2['Date'].apply(
        lambda x:True if datetime.strptime(str(x).split()[0],'%Y-%m-%d').weekday() == 0
        and 1 <= datetime.strptime(str(x).split()[0],'%Y-%m-%d').day <= 7 else False)].index,:].set_index('Date').index

holidays = pd.date_range(start='1981-5-1', end='1981-5-3').append(pd.date_range('1981-10-1', end='1981-10-7')).\
    append(pd.date_range(start='1982-5-1', end='1982-5-3')).append(pd.date_range('1982-10-1', end='1982-10-7')).\
    append(pd.date_range(start='1983-5-1', end='1983-5-3')).append(pd.date_range('1983-10-1', end='1983-10-7')).\
    append(pd.date_range(start='1984-5-1', end='1984-5-3')).append(pd.date_range('1984-10-1', end='1984-10-7')).\
    append(pd.date_range(start='1985-5-1', end='1985-5-3')).append(pd.date_range('1985-10-1', end='1985-10-7')).\
    append(pd.date_range(start='1986-5-1', end='1986-5-3')).append(pd.date_range('1986-10-1', end='1986-10-7')).\
    append(pd.date_range(start='1987-5-1', end='1987-5-3')).append(pd.date_range('1987-10-1', end='1987-10-7')).\
    append(pd.date_range(start='1988-5-1', end='1988-5-3')).append(pd.date_range('1988-10-1', end='1988-10-7')).\
    append(pd.date_range(start='1989-5-1', end='1989-5-3')).append(pd.date_range('1989-10-1', end='1989-10-7')).\
    append(pd.date_range(start='1990-5-1', end='1990-5-3')).append(pd.date_range('1990-10-1', end='1990-10-7')).\
    append(s_date)


date_index = pd.bdate_range(start='1981-1-1', end='1990-12-31',freq='C', weekmask='Mon Tue Wed Thu Fri Sat Sun', holidays=holidays)
df_2.loc[df_2['Date'].isin(date_index)].set_index('Date').resample('MS').min()

df_2 = df_2.set_index('Date')
df_2.resample('MS').min().sum() / df_2.resample('YS').min().sum()
Temp    75.009804
dtype: float64

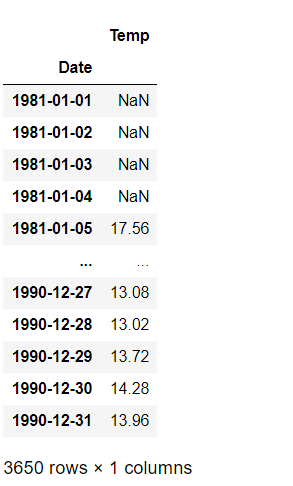
(a) 求原序列的 5 期移动平均序列。
df_2.rolling(window=5).mean()
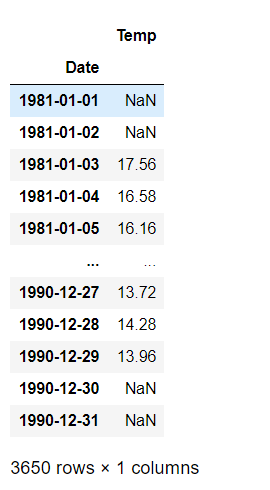
(b) 求原序列的 5 期与 6 期中心移动平均序列。
df_2.rolling(window=5, center=True).mean()
df_2.rolling(window=6, center=True).mean()
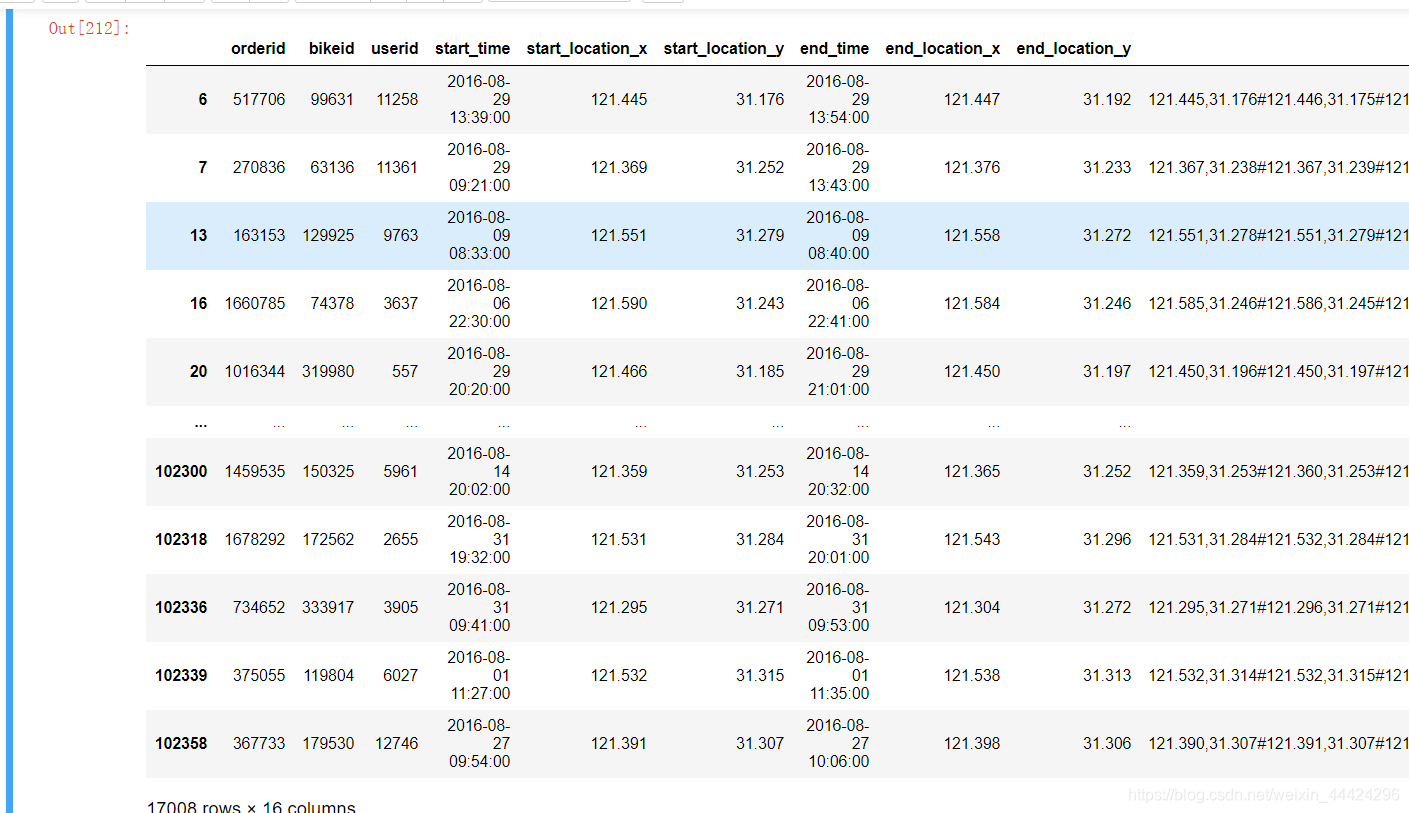
三、2016 年 8 月上海市摩拜单车骑行记录
(1) 平均而言,周末单天用车量比工作日单天用车量更大吗?
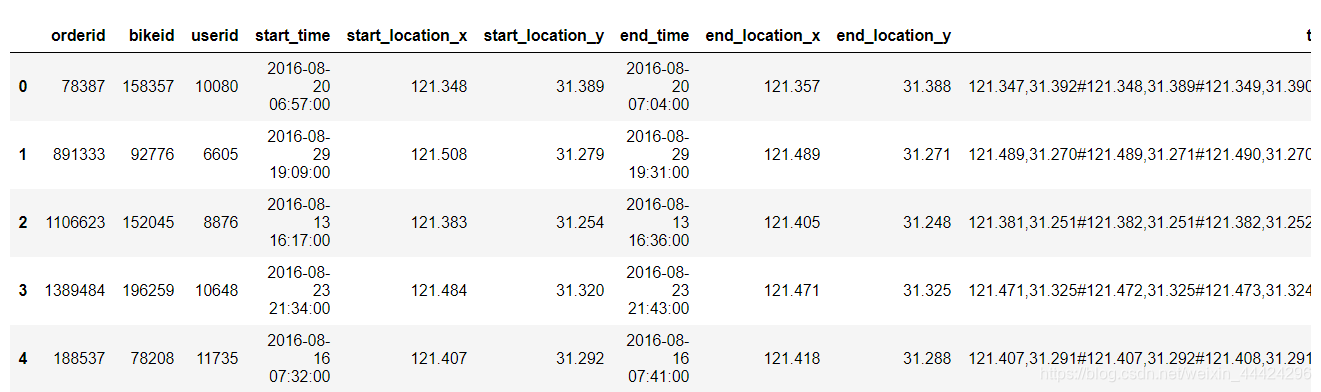
df_3 = pd.read_csv('../data/摩拜单车数据.csv', parse_dates=['start_time', 'end_time'])
df_3.head()
df_3.info()
<class 'pandas.core.frame.DataFrame'>
RangeIndex: 102361 entries, 0 to 102360
Data columns (total 10 columns):
 #   Column            Non-Null Count   Dtype
---  ------            --------------   -----
 0   orderid           102361 non-null  int64
 1   bikeid            102361 non-null  int64
 2   userid            102361 non-null  int64
 3   start_time        102361 non-null  datetime64[ns]
 4   start_location_x  102361 non-null  float64
 5   start_location_y  102361 non-null  float64
 6   end_time          102361 non-null  datetime64[ns]
 7   end_location_x    102361 non-null  float64
 8   end_location_y    102361 non-null  float64
 9   track             102361 non-null  object
dtypes: datetime64[ns](2), float64(4), int64(3), object(1)
memory usage: 7.8+ MB
# 获取日期
df_3['date'] = df_3['start_time'].apply(lambda x: str(x)[:10])

df_weekend = df_3.loc[df_3['start_time'].dt.dayofweek.isin([5, 6])]
weekend = len(df_weekend) / df_weekend['date'].nunique()
weekend
# 周密单日用车辆
3275.125
df_weekdays = df_3.loc[~df_3['start_time'].dt.dayofweek.isin([5, 6])]
weekdays = len(df_weekdays) / df_weekdays['date'].nunique()
weekdays
# 平时单日用车量
3311.304347826087
(2) 工作日每天的高峰时间段大致为上午 7:30 至 9:30、下午 17:00 至 19:00,
请问 8 月里早高峰骑行记录量(以 start_time 为准)高于晚高峰的有
几天?
from datetime import datetime

start_morn = datetime.strptime('7:30', '%H:%M').time()
end_morn = datetime.strptime('9:30', '%H:%M').time()
df_w_morn = df_weekdays.loc[(df_weekdays['start_time'].dt.time >= start_morn) & (df_weekdays['start_time'].dt.time <= end_morn)]
# 获取早上用车量
s_morn = df_w_morn.groupby('date')['orderid'].count()

start_after = datetime.strptime('17:00', '%H:%M').time()
end_after = datetime.strptime('19:00', '%H:%M').time()
df_w_after = df_weekdays.loc[(df_weekdays['start_time'].dt.time >= start_after) & (df_weekdays['start_time'].dt.time <= end_after)]
# 获取下午用车量
s_after = df_w_after.groupby('date')['orderid'].count()

number = 0
total = list((s_morn - s_after).values)

for i in total:
    if i >=0:
        number += 1

number
# 只有3天
3
(3) 请给出在所有周五中(以 start_time 为准),记录条数最多的那个周五
所在的日期,并在该天内分别按 30 分钟、2 小时、6 小时统计摩拜单车
使用时间的均值。
# 获取周五
df_fri = df_weekdays[df_weekdays['start_time'].dt.dayofweek.isin([4])]

df_fri.groupby('date')['orderid'].count().idxmax()
'2016-08-26'
df_26 = df_fri.loc[df_fri['date'] == '2016-08-26']
df_26['use_time'] = df_26['end_time'] - df_26['start_time']

# 建立分桶
list_time = [pd.Timedelta(minutes=0), pd.Timedelta(minutes=30), pd.Timedelta(hours=2), pd.Timedelta(hours=6)]

df_26['group_time'] = pd.cut(df_26['use_time'], bins=list_time)
df_26.groupby('group_time')['use_time'].sum() / df_26.groupby('group_time')['use_time'].count()
group_time
(0 days 00:00:00, 0 days 00:30:00]   00:12:04.639175
(0 days 00:30:00, 0 days 02:00:00]   00:49:03.421588
(0 days 02:00:00, 0 days 06:00:00]   02:34:37.142857
Name: use_time, dtype: timedelta64[ns]
(4) 请自行搜索相关代码或调用库,计算每条记录起点到终点的球面距离。
import math
EARTH_RADIUS = 6371
def cal_dis_meters(latitude1, longitude1,latitude2, longitude2):
radLat1 = (math.pi/180)*latitude1
radLat2 = (math.pi/180)*latitude2
radLng1 = (math.pi/180)*longitude1
radLng2= (math.pi/180)*longitude2
d = []
for i in range(len(latitude1)):
d1=2.0*math.asin(math.sqrt(math.pow(math.sin((radLat1[i]-radLat2[i])/2.0),2)+math.cos(radLat1[i])*math.cos(radLat2[i])*math.pow(math.sin((radLng1[i]-radLng2[i])/2.0),2)))*EARTH_RADIUS
d.append(d1)
for i in range(len(d)):
d[i] = round(d[i], 2)
return d
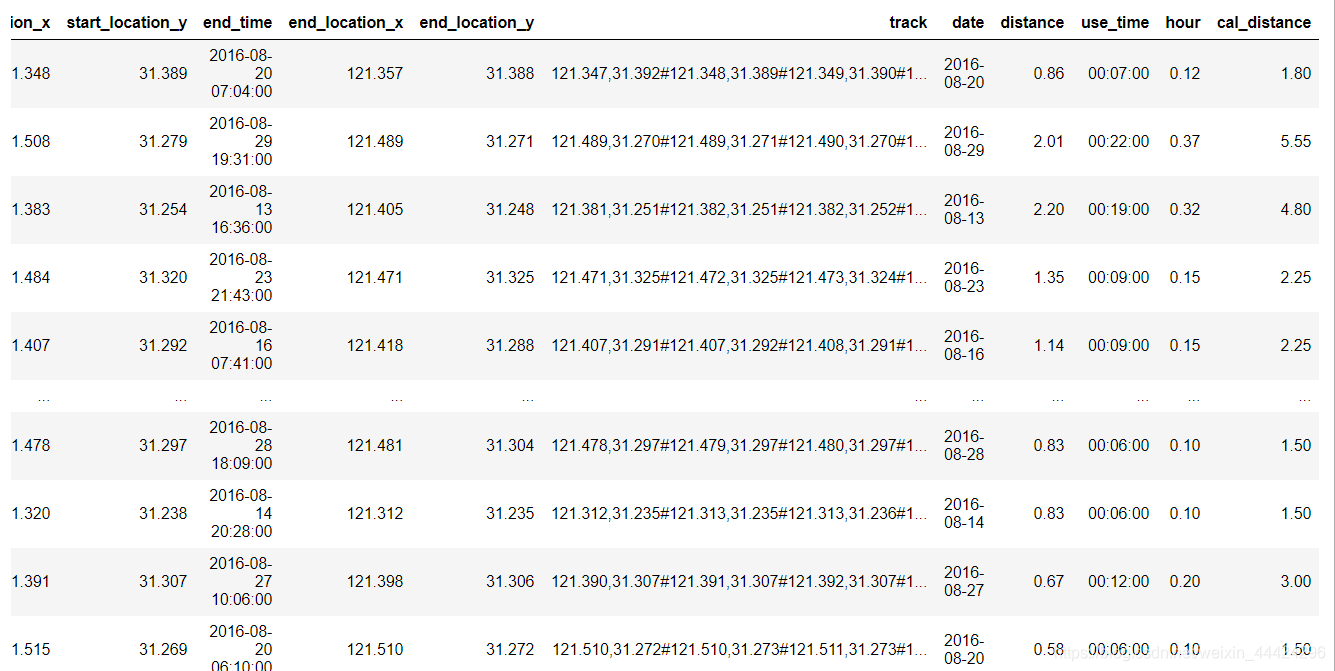
df_3['distance'] = cal_dis_meters(df_3['start_location_y'], df_3['start_location_x'], df_3['end_location_y'], df_3['end_location_x'])
df_3

(5) 摩拜单车的骑行结束时间是以电子锁关闭的记录时间为准,但有时候用
户会忘记关锁,导致骑行时间出现异常。同时,正常人的骑行速度往往
大致落在一个合理的区间,请结合上一问中的球面距离和骑行起始、结
束时间,找出潜在的异常骑行记录。
df_3['use_time'] = df_3['end_time'] - df_3['start_time']

df_3['use_time'] = df_3['use_time'].apply(lambda x: str(x)[7:])
# 分钟转成小时
def min2hou(x):
    h = x[1]
    m = x[3:5]

    if m[0] == '0':
        m = m[1]
    return round(int(h) + int(m)/60, 2)

df_3['hour'] = df_3['use_time'].apply(min2hou)
df_3['cal_distance'] = df_3['hour'] * 15
df_3
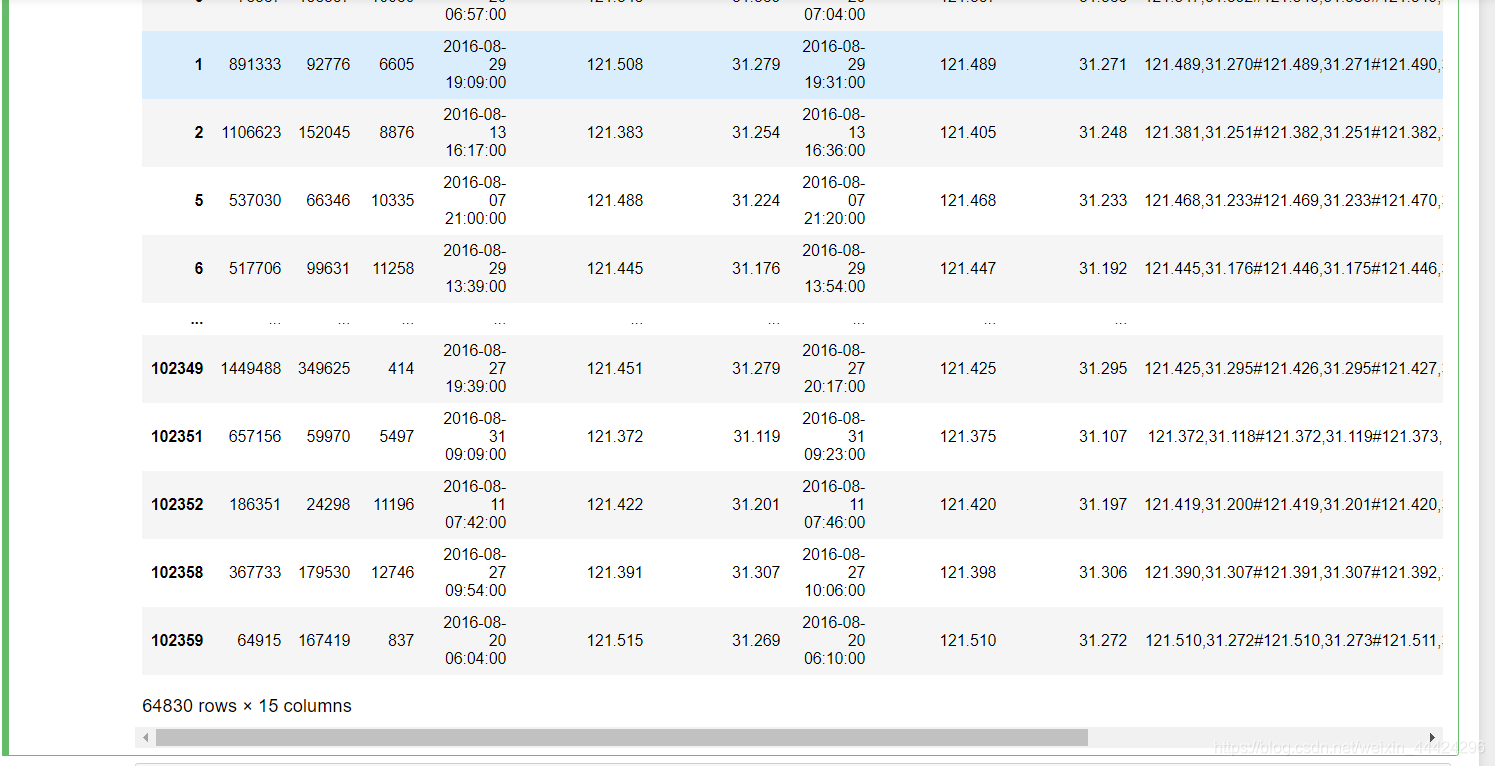
df_3.loc[(df_3['cal_distance'] / df_3['distance']) >= 2]
(6) 由于路线的曲折性,起点到终点的球面距离往往不能充分反应行程长
度,请利用 track 列的路线坐标数据,计算估计实际骑行距离,并重新
仿照上一问的方法找出可能的异常记录。
# 居然还有脏数据 我的天
s = df_3.loc[df_3['track'].str.contains(r'[\\]')]['track'].str.replace('\\', '')
df_3.loc[df_3['track'].str.contains(r'[\\]'), 'track'] = s

# 弄个元组列表
result = []

for i in range(len(df_3)):
    list_temp = df_3['track'][i].split('#')
    result_temp = []
    for j in range(len(list_temp)):
        list_temp1 = list_temp[j].split(',')
        zip_temp = list(zip([float(list_temp1[0])], [float(list_temp1[1])]))
        result_temp.extend(zip_temp)

    result.append(result_temp)

def cal_real_meters(latitude1, longitude1,latitude2, longitude2):
    radLat1 = (math.pi/180)*latitude1
    radLat2 = (math.pi/180)*latitude2
    radLng1 = (math.pi/180)*longitude1
    radLng2= (math.pi/180)*longitude2
    d=2.0*math.asin(math.sqrt(math.pow(math.sin((radLat1-radLat2)/2.0),2)+math.cos(radLat1)*math.cos(radLat2)*math.pow(math.sin((radLng1-radLng2)/2.0),2)))*EARTH_RADIUS
    return d

real_dist = []

for i in range(len(df_3)):
    d = 0
    for j in range(len(result[i])-1):
        d_temp = cal_real_meters(result[i][j][1], result[i][j][0], result[i][j+1][1], result[i][j+1][0])
        d += d_temp

    real_dist.append(round(d, 2))

real_dist

df_3['real_dist'] = real_dist
df_3.loc[(df_3['cal_distance'] / df_3['real_dist']) >= 2]