
import pandas as pd
import numpy as np
import missingno as msno
import matplotlib.pyplot as plt
plt.rcParams['font.sans-serif']=['SimHei'] #用来正常显示中文标签
plt.rcParams['axes.unicode_minus']=False #用来正常显示负号

#读取数据
df = pd.read_csv('端午粽子数据.csv')
df.columns = df.columns.str.strip()
df.columns
print(msno.matrix(df))![]()
df = df.drop(df.index[df['发货地址'].isnull()],axis=0)
# df_1 = df[df['发货地址'].str.contains(r'[杭州]{2}')]
def is_number(x):
    try:
        float(x)
        return True
    except (SyntaxError,ValueError) as e :
        return False

df[~df.价格.map(is_number)]
df.loc[[538,4376],'价格']=['45.9','45.0']
df['价格'] = df['价格'].astype(float)
df_1 = df[df['发货地址'].str.contains(r'[杭州]{2}')]
df_1['价格'].mean()
结果为:
![]()
![]()
df[df['标题'].str.contains(r'[嘉兴]{2}') & ~(df['发货地址'].str.contains(r'[嘉兴]{2}'))]

df['价格'].describe(percentiles=[.2,.4,.6,.8]).loc[['20%','40%','60%','80%']]
df['new_价格'] = pd.cut(df['价格'],[0.0,29.3,43.9,69.84,124.80,np.inf],labels=['低','较低','中','较高','高'])
df.set_index('new_价格').sort_index(ascending=False).head()

df['new_付款人数'] = df['付款人数'].astype('string').str.extract(r'(\d+(\.\d+)?)')[0]
# df['new_付款人数_wan'] = df['付款人数'].astype('string').str.extract(r'(\d+\.?\d*\d+)',expand=False)
df['new_付款人数'] = pd.to_numeric(df['new_付款人数'],errors='coerce')
df['付款人数'] = df['付款人数'].apply(str)
s1 = pd.to_numeric((df[df['付款人数'].str.contains(r'[万]{1}')]['new_付款人数']*10000))
s2 = pd.to_numeric(df[~(df['付款人数'].str.contains(r'[万]{1}'))]['new_付款人数'])
df['new_付款人数']= pd.concat([s1,s2],axis=0)

#查看缺失值数量
print(df['new_付款人数'].isnull().sum())
print(df.index[df['new_付款人数'].isnull()])
print(df.loc[183])
g = df.groupby(df['new_价格'])
# g.groups
print(g.get_group('低')['new_付款人数'].isnull().sum())
print(g.get_group('较低')['new_付款人数'].isnull().sum())
print(g.get_group('中')['new_付款人数'].isnull().sum())
print(g.get_group('较高')['new_付款人数'].isnull().sum())
print(g.get_group('高')['new_付款人数'].isnull().sum())

#求均值
print(g.get_group('低')['new_付款人数'].mean())
print(g.get_group('较低')['new_付款人数'].mean())
print(g.get_group('中')['new_付款人数'].mean())
print(g.get_group('较高')['new_付款人数'].mean())
print(g.get_group('高')['new_付款人数'].mean())

#缺失值填充
df['new_付款人数'].fillna(g.get_group('低')['new_付款人数'].mean(),inplace=True)
df['new_付款人数'].isnull().sum()
存在问题:通过之前对价格的分类对数据进行分类填充,但是在填充时,发现不能分组填充,只能一次性填充,这个问题待思考解决。

#字符串拼接
address = []
for i in df['发货地址'].str.split(' '):
    if len(i)>1:
        add = i[0]+i[1]
    else:
        add = i[0]
    address.append(add)
df['new_发货地址']= address
('商品发货地为'+df['new_发货地址']+',店铺为'+df['店铺']+',共计'+df['付款人数']+',单价为'+df['价格']).to_frame().rename(columns={0:'ID'})

#apply函数
s = df.apply(lambda r:f'商品发货地址为{r["new_发货地址"]},店铺为{r["店铺"]},共计{r["付款人数"]},单价为{r["价格"]}',axis=1).to_frame().rename(columns={0:'ID'})
s![]()
address = []
shops = []
persons = []
prices = []
for i in s['ID'].str.split(','):
    add = i[0].split('为')[1]
    if len(add)>3:
        add = add[:2] + ' ' + add[2:]
    shop = i[1].split('为')[1]
    person = i[2].split('计')[1]
    price  = i[3].split('为')[1]
    address.append(add)
    shops.append(shop)
    persons.append(person)
    prices.append(price)
s['发货地址'] = address
s['店铺'] = shops
s['付款人数'] = persons
s['价格'] = prices
print(s)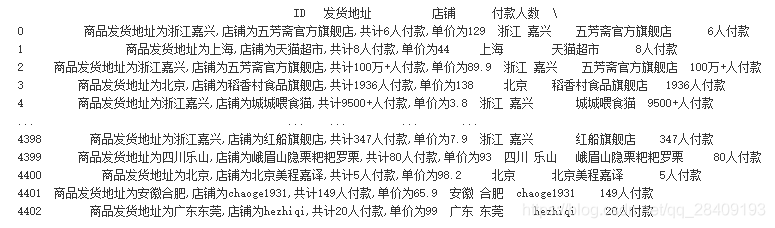

df = pd.read_csv('墨尔本温度数据.csv')
df![]()
holiday = pd.date_range(start='19810501', end='19810503').append(
          pd.date_range(start='19820501', end='19820503')).append(
          pd.date_range(start='19830501', end='19830503')).append(
          pd.date_range(start='19840501', end='19840503')).append(
          pd.date_range(start='19850501', end='19850503')).append(
          pd.date_range(start='19860501', end='19860503')).append(
          pd.date_range(start='19870501', end='19870503')).append(
          pd.date_range(start='19880501', end='19880503')).append(
          pd.date_range(start='19890501', end='19890503')).append(
          pd.date_range(start='19900501', end='19900503')).append(
          pd.date_range(start='19811001', end='19811007')).append(
          pd.date_range(start='19821001', end='19821007')).append(
          pd.date_range(start='19831001', end='19831007')).append(
          pd.date_range(start='19841001', end='19841007')).append(
          pd.date_range(start='19851001', end='19851007')).append(
          pd.date_range(start='19861001', end='19861007')).append(
          pd.date_range(start='19871001', end='19871007')).append(
          pd.date_range(start='19881001', end='19881007')).append(
          pd.date_range(start='19891001', end='19891007')).append(
          pd.date_range(start='19891001', end='19891007')).append(
          pd.date_range(start='19810101', end='19901231',freq='BMS'))
holiday = holiday.drop_duplicates()
df['Date'] = pd.to_datetime(df['Date'])
result = df[~df['Date'].isin(holiday)].set_index('Date').resample('M').mean()
result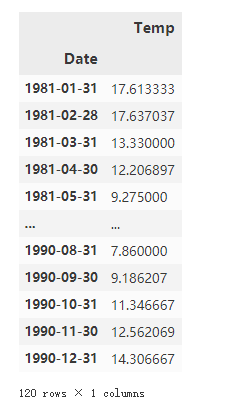

#常规法
years = []
months = []
for i in df['Date'].astype('string').str.split('-'):
        year = i[0]
        month = str(int(i[1]))
        years.append(year)
        months.append(month)
df['Y'] = years
df['M'] = months
Y = df.groupby('Y')
M = df.groupby(['Y','M'])
tempYlist = []
tempYZlist = []
for i in range(1981,1991):
    tempYlist = []
    for j in range(1,13):
         tempY = Y.get_group(str(i))[Y.get_group(str(i))['M']==str(j)]['Temp'].min()
#          print(tempY)
         tempYlist.append(tempY)
    Ymean = np.sum(np.mean(tempYlist))
tempMZlist = []
for i in range(1,13):
    tempMlist = []
    for j in range(1981,1991):
        tempM = Y.get_group(str(j))[Y.get_group(str(j))['M']==str(i)]['Temp'].min()
        tempMlist.append(tempM)
    print(tempMlist)
    tempMZlist.append(np.mean(tempMlist))
Sj = tempMZlist/Ymean
Sj

import pandas as pd
import numpy as np
import datetime
df = pd.read_csv('摩拜单车数据.csv')
df['new_start_time'] = pd.to_datetime(df['start_time'] )
df['new_start_time'] = pd.to_datetime(df['new_start_time'].apply(lambda x:datetime.datetime.strftime(x,'%Y-%m-%d')))
# datetime.datetime.strftime(df['new_start_time'][0],'%Y-%m-%d')![]()
df['start_time'] = pd.to_datetime(df['start_time'])
df['work_week'] = df['start_time'].dt.dayofweek
df.groupby('work_week').size()
对数据按星期分类,0-6代表星期一到星期天,统计每天的交易量

data = df.groupby('new_start_time')
zts = pd.Timestamp('2016-07-31 07:30')
zte = pd.to_datetime('2016-07-31 09:30')
wts = pd.to_datetime('2016-07-31 17:30')
wte = pd.to_datetime('2016-07-31 19:00')
time = pd.to_datetime('2016-07-31 00:00:00')
times = []
countZs = []
countWs = []
for i in range(1,32):
    zts = zts + pd.offsets.Day()
    zte = zte + pd.offsets.Day()
    wts = wts + pd.offsets.Day()
    wte = wte + pd.offsets.Day()
    time = datetime.datetime.strftime(time + pd.offsets.Day(),'%Y-%m-%d %H:%M:%S')
    countZ = data.get_group(time)[(data.get_group(time)['start_time']>= zts) & (data.get_group(time)['start_time']<= zte)]['start_time'].count()
    countW = data.get_group(time)[(data.get_group(time)['start_time']>= wts) & (data.get_group(time)['start_time']<= wte)]['start_time'].count()
#     print(countZ,countW)
    time = pd.Timestamp(time)
    times.append(time)
    countZs.append(countZ)
    countWs.append(countW)
workdf = pd.DataFrame()
workdf['time']=times
workdf['countZ']=countZs
workdf['countW']=countWs
workdf['time'] = pd.to_datetime(workdf['time'])
workday = pd.date_range(start='2016-08-01',end='2016-08-31 ',freq='B')
workdf[workdf['time'].isin(workday)][workdf['countZ']>workdf['countW']]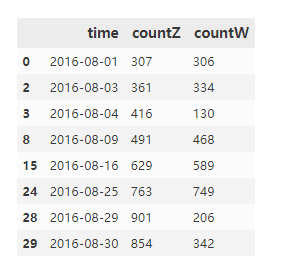

统计出8月份每周五的记录量
f = df[df['work_week']==4].groupby('new_start_time')
print(f.size())

data = df[df['new_start_time']==pd.to_datetime('2016-08-26')]
data['end_time'] = pd.to_datetime(data['end_time'])
data['start_time'] = pd.to_datetime(data['start_time'])
data['time_sep'] = (data['end_time']-data['start_time']).dt.seconds/60
data['new_time_sep'] = pd.cut(data['time_sep'],[0,30,120,360],labels=['one','two','three'])
data.set_index(['new_time_sep'])
one = data[data['new_time_sep']=='one']['time_sep'].mean()
two = data[data['new_time_sep']=='two']['time_sep'].mean()
three = data[data['new_time_sep']=='three']['time_sep'].mean()
print(one,two,three)![]()
![]()
#公式计算
import math
lon1 = df['start_location_x']
lat1 = df['start_location_y']
lon2 = df['end_location_x']
lat2 = df['end_location_y']
R = 6371
dlon = lon2 - lon1
dlat = lat2 - lat1
a = (np.sin(dlat/2))**2 + np.cos(lat1) * np.cos(lat2) * (np.sin(dlon/2))**2
c = 2 * np.arctan2(np.sqrt(a), np.sqrt(1-a))
d = R * c

#geopy
!pip install geopy
import geopy.distance
# print (geopy.distance.distance(coords_1, coords_2).km)
lon1 = df['start_location_x'].tolist()
lat1 = df['start_location_y'].tolist()
lon2 = df['end_location_x'].tolist()
lat2 = df['end_location_y'].tolist()
coords_1 = list(zip(lat1, lon1))
coords_2 = list(zip(lat2, lon2))
dist = []
for i,j in zip(coords_1,coords_2):
    dis = geopy.distance.distance(i, j).km
    dist.append(dis)
#距离
df['dis'] = d

#匀速=距离/时间
df['sudu'] = df['dis']/df['time_sep']


#3sigmoid筛选一禅
Dmean = df['sudu'].mean()
Dstd = df['sudu'].std()
#阈值
thre1 = Dmean-3*Dstd
thre2 = Dmean+3*Dstd
#异常值
outlies = df[(df['sudu']<thre1) | (df['sudu']>thre2)]
画图展示:
#未处理之前
plt.figure()
plt.scatter(range(df.shape[0]),df['sudu'].tolist())
plt.xlabel('用户')
plt.ylabel('速度值')
plt.title('未处理缺失值-速度图像')
plt.show()


#处理之后
Dmean = df['sudu'].mean()
Dstd = df['sudu'].std()

thre1 = Dmean-3*Dstd
thre2 = Dmean+3*Dstd

outlies = df.index[(df['sudu']<thre1) | (df['sudu']>thre2)]

data = df.drop(outlies,axis=0)

plt.figure()
plt.scatter(range(data.shape[0]),data['sudu'].tolist())
plt.xlabel('用户')
plt.ylabel('速度值')
plt.title('处理缺失值-速度图像')
plt.show()
