认真观看该视频得到的代码和产物,讲解nice。
创建文件
 	#内容
    content={'ID':[1,2,3],'name':['A','B','C']}
    #创建DF
    pd=pd.DataFrame(content)
    # 手动设置索引的列名
    pd=pd.set_index('ID')
    #文件保存的路径
    savePath='/Users/apple/Desktop/test01.xlsx'
    # 保存文件
    pd.to_excel(savePath)
    print('Done')
读取文件
 # 读取文件的路径
    readPath=''

	# 读取文件
    # header默认把第0行的数据当作header  header=2 把第二行作为header
    # 默认提供index_col,ndex_col='ID' 设置ID列为index
    # skiprows=3  跳过3行
    #usecols="A:F" 打开A到F列
    # dtype={'ID':int}指定ID为int类型
    # 关于其他参数 可以自行百度
    week=pd.read_excel(readPath,header=2,index_col='ID',skiprows=3,
                       usecols="A:F",dtype={'ID':int})
    # 文件的行列数量(行,列)
    print(week.shape)

    # 文件的列名
    print(week.columns)

    #遍历文件前五行  默认5行
    print(week.head())

    #遍历文件后五行  默认5行
    print(week.tail())
行列单元格的处理(Series)
  # Series其实就是一行(列)数据,是行还是列取决于插入dataFrame时用的是字典格式还是列表格式
    s1 = pd.Series([1, 2, 3], index=[1, 2, 3], name='A')
    s2 = pd.Series([10, 20, 30], index=[1, 2, 3], name='B')
    s3 = pd.Series([100, 200, 300], index=[1, 2, 3], name='C')

    # 按行插入
    data = pd.DataFrame([s1, s2, s3])

    # 按列插入
    data = pd.DataFrame({s1.name: s1, s2.name: s2, s3.name: s3})
    print(data)
数字填充、日期填充
from datetime import date, datetime

import pandas as pd

readPath=''

test = pd.read_excel(readPath)

# 获取到单元格  然后按照你想要的规则赋值
#获取单元格:test['ID'].at[i] 等价于 test.at[i,'ID']

# NAN默认变成浮点类型

# 数字+1填充
for i in test.index:
    test.at[i, 'ID'] = i + 1

# 日期填充

# 增加日期列
s1 = pd.Series(['2020-11-01', '', ''], index=[0, 1, 2], name='time')
test[s1.name] = s1.values

# 获取第一个单元格  转换为日期
firstData = datetime.strptime(test['time'].at[0], "%Y-%m-%d")

# 年份+1填充
for i in test.index:
    test['time'].at[i] = date(firstData.year + i, firstData.month, firstData.day)

print(test)

# 月份+1填充  因为12月进1年 所以需要小算法处理
def add_month(cellDate, addMonthNumber):
    year = cellDate.year + addMonthNumber // 12
    month = cellDate.month + addMonthNumber % 12
    # 如果月份大于12
    if month > 12:
        year += month // 12
        month = month % 12
    day = cellDate.day
    return date(year, month, day)

for i in test.index:
    test['time'].at[i] = add_month(firstData, i)
print(test)

# 天数+1填充

# 天数更复杂 要列举12个月的天数  以及区分闰年、平年

# 判断是否是闰年
def judgeYears(years):
    if ((years % 4 == 0 and years % 100 != 0) or (years % 400 == 0)):
        return True
    else:
        return False

def add_day(cellDate, addDayNumber):
    # 每年每个月有多少天
    yearMonthDays = {}

    # 当前是哪年
    year = cellDate.year

    # 当前年有总共多少天
    yearWithDays = 0

    # 初始化属性 每年每个月有多少天
    if (judgeYears(year)):
        # 闰年  二月29天
        yearMonthDays = {1: 31, 3: 31, 5: 31, 7: 31, 8: 31, 10: 31,
                         12: 31, 4: 30, 6: 30, 9: 30, 11: 30, 2: 29}
        yearWithDays = 366
    else:
        # 平年  二月28天
        yearMonthDays = {1: 31, 3: 31, 5: 31, 7: 31, 8: 31, 10: 31,
                         12: 31, 4: 30, 6: 30, 9: 30, 11: 30, 2: 28}
        yearWithDays = 365

    # 处理年数
    while addDayNumber // yearWithDays > 0:
        # addDayNumber减去当前年的总天数
        addDayNumber -= yearWithDays
        # 当前年份+1
        year += 1

        # 根据新的一年  重新配置今年的总天数和二月天数
        if judgeYears(year):
            # 闰年
            yearMonthDays[2] = 29
            yearWithDays = 366

        else:
            # 平年
            yearMonthDays[2] = 28
            yearWithDays = 365

    # 此时循环出来的addDayNumber定是小于365的  所有只需要考虑月份就好了

    # 当前是几月
    month = cellDate.month
    # 当前月份有多少天
    monthWithdays = yearMonthDays[cellDate.month]
    # 当前是几号
    day = cellDate.day

    # 处理月份
    # 如果addDayNumber大于当前月份的天数  月份+1
    while addDayNumber > monthWithdays:

        # 把addDayNumber减去当月的天数
        addDayNumber -= monthWithdays
        # 把当前月+1
        month += 1
        # 判断  当前月是否>12
        if month > 12:
            # 进位的年数加上对应的数量
            year += month // 12
            # 月份重新计数
            month = month % 12
            # 此时 年份已经变  应该考虑 是否闰年
            if judgeYears(year):
                # 闰年
                yearMonthDays[2] = 29
                yearWithDays = 366

            else:
                # 平年
                yearMonthDays[2] = 28
                yearWithDays = 365

        # 更新+1后的月有多少天
        monthWithdays = yearMonthDays[month]
    # 此时的addDayNumber定小于28  具体是几号为addDayNumber+day  但存在月份进位的情况
    if addDayNumber + day > monthWithdays:
        day = addDayNumber + day - monthWithdays
        # 月份+1
        month += 1
        # 此时判断 月份有没有越界
        if month > 12:
            # 进位的年数加上对应的数量
            year += month // 12
            # 月份重新计数
            month = month % 12
            # 此时 年份已经变  应该考虑 是否闰年
            if judgeYears(year):
                # 闰年
                yearMonthDays[2] = 29
                yearWithDays = 366

            else:
                # 平年
                yearMonthDays[2] = 28
                yearWithDays = 365
    else:
        day = day + addDayNumber
    return date(year, month, day)


for i in test.index:
    test['time'].at[i] = add_day(firstData, i)

print(test)
列之间的加减乘除(折扣价格=单价*折扣)
import pandas as pd

readPath=''

test = pd.read_excel(readPath)

# 这种方式非常简便  但是不适应  区域数据的乘积
test['总金额'] = test['单价'] * test['销售额']

# 指定区域进行数据操作
for i in range(5, 10):
    test['总金额'].at[i] = test['单价'].at[i] * test['销售额'].at[i] * 10

# apply操作  对每个元素做同样操作
# lambda 可以理解为简化的函数
test['总金额'] = test['单价'].apply(lambda x: x + 2)
print(test)
数据排序在这里插入代码片

import  pandas as pd
readPath=''
sort=pd.read_excel(readPath)
print(sort)
#by 排序字段   多个字段用列表
# ascending  False 降序  多个字段用列表
# inplace    True  不生成新的rdd
sort.sort_values(by=['单价','销售额'],ascending=[False,False],inplace=True)
print(sort)
数据筛选和过滤
import pandas as pd

readPath=''
filter = pd.read_excel(readPath)
# 过滤掉总金额小于600的
# loc相当于where

filter = filter.loc[filter.总金额.apply(lambda x: x >= 600)]
print(filter)
行操作集锦
import pandas as pd

readPah = '/Users/apple/Desktop/test.xlsx'
re1 = pd.read_excel(readPah, sheet_name='Sheet1', dtype={'time': str})
re2 = pd.read_excel(readPah, sheet_name='Sheet2', dtype={'time': str})
# 两个DF拼接  重新调整index
re1 = re1.append(re2).reset_index(drop=True)

# 表格结尾插入新的series
newSeries = pd.Series({'ID': 41, 'money': 41, 'category': 3, 'time': '2020.1.1'})
re1 = re1.append(newSeries, ignore_index=True)

# 更改某个单元格的值  纵横交错定位一个单元格  用at赋值
re1.at[37, 'category'] = 2

# 替换某行的全部数据去更改某个单元格的值
newSeries = pd.Series({'ID': 41, 'money': 50, 'category': 2, 'time': '2020.1.1'})
# iloc 是index location的意思  索引定位
re1.iloc[37] = newSeries

# 表格中间插入某行数据  先把表格从插入点切割开,然后拼接组装
newSeries = pd.Series({'ID': 2, 'money': 50, 'category': 2, 'time': '2020.1.1'})
part1 = re1[:2]
part2 = re1[2:]
re1 = part1.append(newSeries, ignore_index=True).append(part2).reset_index(drop=True)

# 删除数据行
re1.drop(index=[0, 1, 2], inplace=True)

# 删除数据行  通过条件去删除某行
# 删除所有类别为1的列
deleteRows = re1.loc[re1.category == 1]
re1.drop(index=deleteRows.index, inplace=True)
# 删除后index不规整 重新设置index
re1 = re1.reset_index(drop=True)
print(re1)
列集锦操作
import numpy as np
import pandas as pd

readPah = '/Users/apple/Desktop/test.xlsx'
re1 = pd.read_excel(readPah, sheet_name='Sheet1', dtype={'time': str})
re2 = pd.read_excel(readPah, sheet_name='Sheet2', dtype={'time': str})
# concat 当axis=1 左右拼接
# concat 当axis=0 上下拼接
re3 = pd.concat([re1, re2]).reset_index(drop=True)
# 添加一列  如果是一个数 则整列填充
# re3['newColumn']='ceshi'
# 添加一列 从0开始填充
re3['newColumn'] = np.arange(0, len(re3))
# 删除一列
re3.drop(columns='newColumn', inplace=True)
# 插入一列  在第1列之后插入
re3.insert(1, column='ceshi', value='3')
# 更改列名  将ceshi更为noceshi
re3.rename(columns={'ceshi': 'noceshi'}, inplace=True)
# 去掉空值(nan)一行扫描 发现nan  整行删除
re3.dropna(inplace=True)
print(re3)
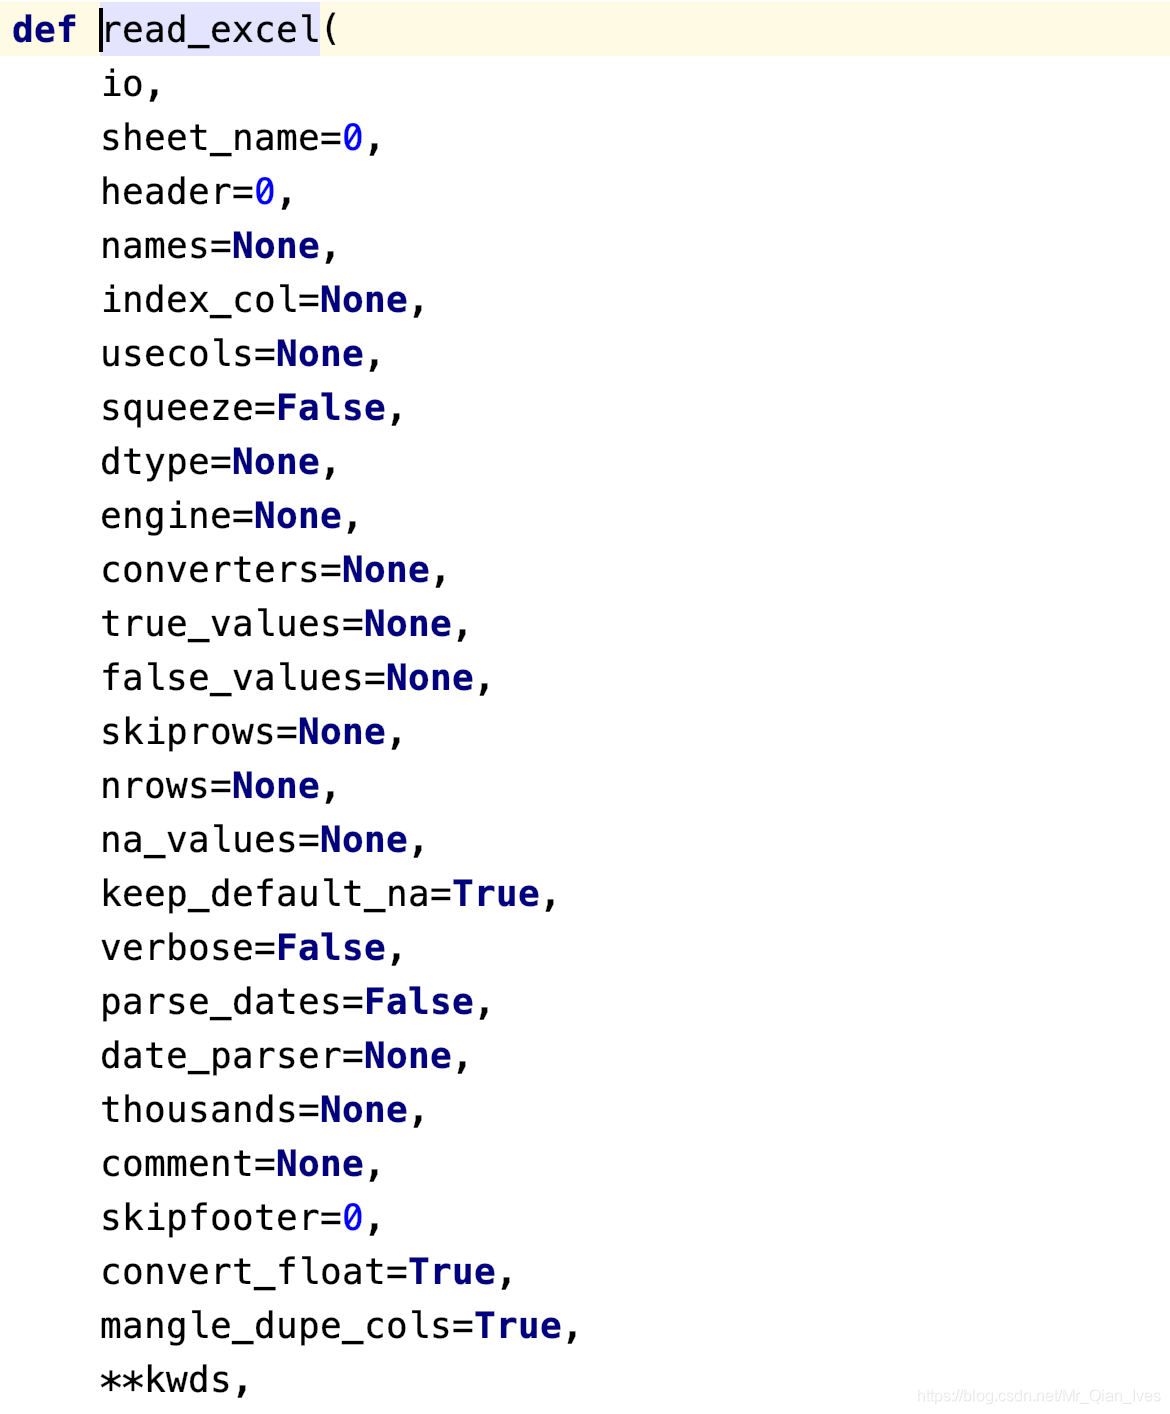
柱形图
import pandas as pd
import matplotlib.pyplot as plt
readPah='/Users/apple/Desktop/test.xlsx'
barShape=pd.read_excel(readPah)
print(barShape)

# 如果数据大小顺序乱  可以排序后再使用图表
# matplotlib.pyplot制图
plt.bar(barShape.name,barShape.money,color='red')
plt.title('nameAndPrice',fontSize='30')

# dataFrame制图
# barShape.plot.bar(x='name',y='money',title='nameAndPrice',color='red')

plt.tight_layout()

plt.show()
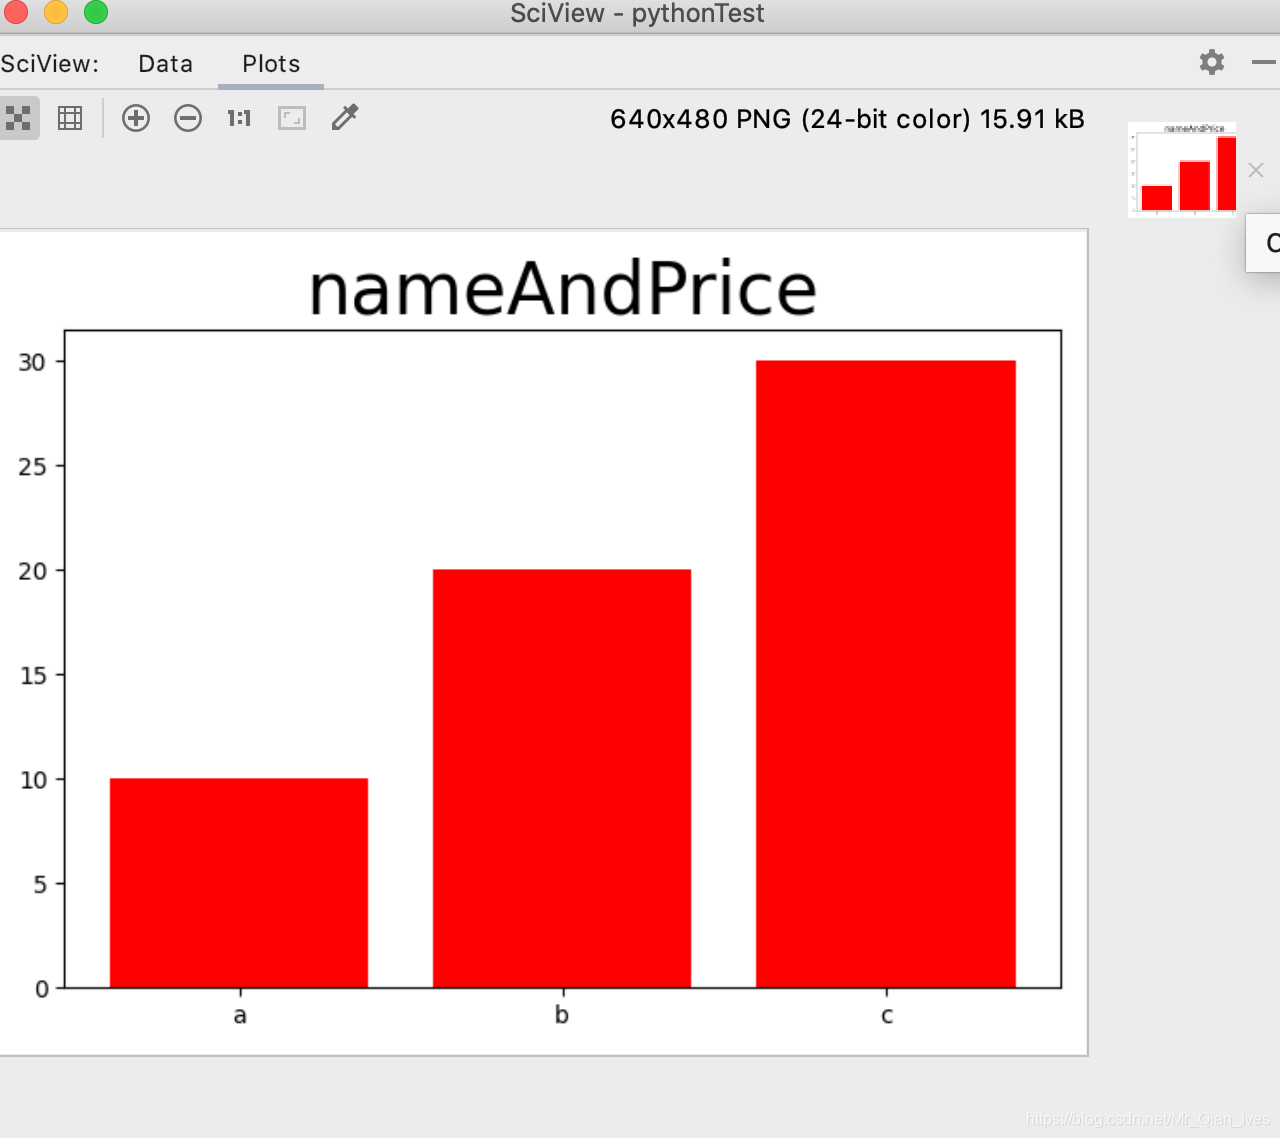
分组柱形图
import pandas as pd
import matplotlib.pyplot as plt
readPah='/Users/apple/Desktop/test.xlsx'
barShape=pd.read_excel(readPah)

# DT.plot.bar制图毕竟使用的是matplotlib的接口 所以会有很多限制
# 但是 matplotlib.pyplot可以补充DT.plot.bar制图的信息

#DT.plot.bar制图  多个y轴图表用列表
barShape.plot.bar(x='name',y=['money','moreMoney'],color=['red','green'])

# matplotlib.pyplot补充DT.plot.bar制图的信息
# 标题 内容 字体大小 字体种类
plt.title('more bar',fontsize=20,fontweight='bold')
# x标签 内容 字体大小 字体种类
plt.xlabel('name',fontweight='bold',fontsize=20)
# y标签 内容 字体大小 字体种类
plt.ylabel('all money',fontweight='bold',fontsize=20)
# 获得轴
ax=plt.gca()
# 设置x轴的标签  旋转  水平对齐
ax.set_xticklabels(barShape.name,rotation=45,ha='right')
# 获得图
f=plt.gcf()
# 图的位置调整  左边留出20%,低端留出42%
f.subplots_adjust(left=0.2,bottom=0.42)

plt.show()
print(barShape)
叠加柱状图

import pandas as pd
import matplotlib.pyplot as plt
readPah='/Users/apple/Desktop/test.xlsx'
barShape=pd.read_excel(readPah)
# 如果想要按照n列叠加总数排序 可以建立一个列 存放叠加列的总和  然后按照叠加列排序

# barShape.plot.barh 是水平的柱形图
# barShape.plot.bar 是竖直的的柱形图
# stacked=True  是叠加图  stacked=True  是分组图
barShape.plot.barh(x='name',y=['money','moreMoney'],stacked=True,title='stacked bar')
plt.tight_layout()
plt.show()
print(barShape)
饼图

import pandas as pd
import matplotlib.pyplot as plt
readPah='/Users/apple/Desktop/test.xlsx'
# 饼图默认用index作为名称  如果不指定index列  饼图的每部分名称 就是0,1,2,3。。。。
pieShape=pd.read_excel(readPah,index_col='name')

# 饼图逆时针排列 counterclock=True   默认不写
# 饼图顺时针排列 counterclock=False
# startangle=-200 开始的角度为-200度
pieShape.money.plot.pie(fontsize=12,counterclock=False,startangle=-200)
print(pieShape)
plt.title('pie',fontsize=18)
# 设置Y轴标签
plt.ylabel('Y-Lable',fontsize=20,fontweight='bold')
plt.show()
折线图和叠加折线图
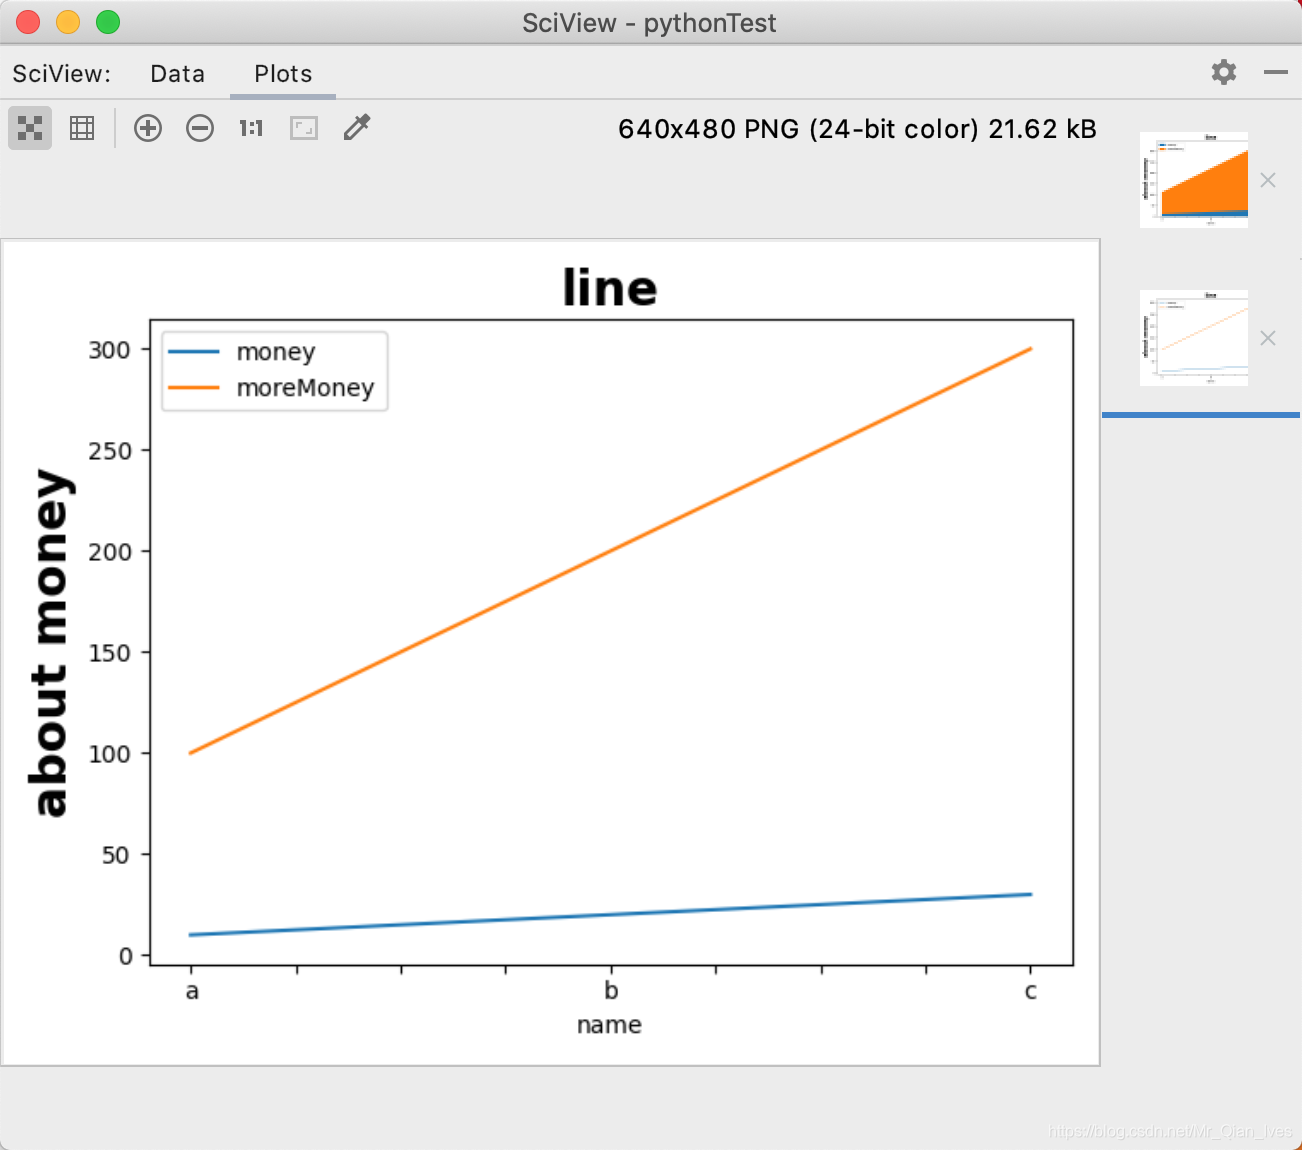
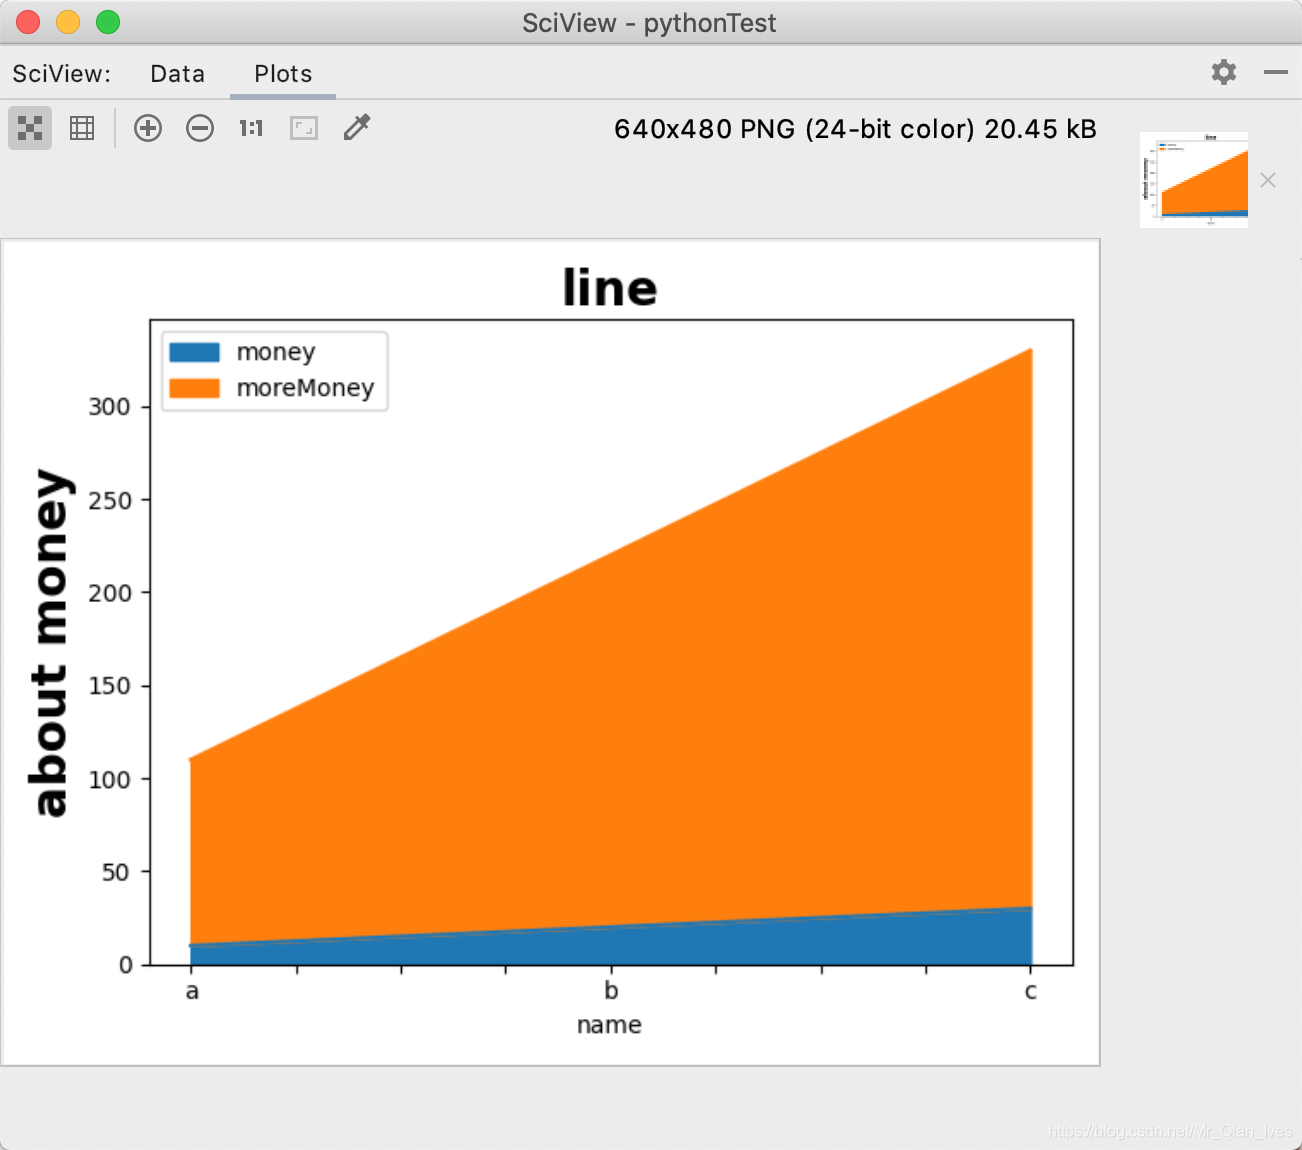
import pandas as pd
import matplotlib.pyplot as plt
readPah='/Users/apple/Desktop/test.xlsx'
lineShape=pd.read_excel(readPah,index_col='name')
print(lineShape)
# 折线图是plot
# lineShape.plot(y=['money','moreMoney'])

#叠加折线图是plot.area
lineShape.plot.area(y=['money','moreMoney'])
plt.title('line',fontsize=20,fontweight='bold')
plt.ylabel('about money',fontsize=20,fontweight='bold')
plt.show()
散点图
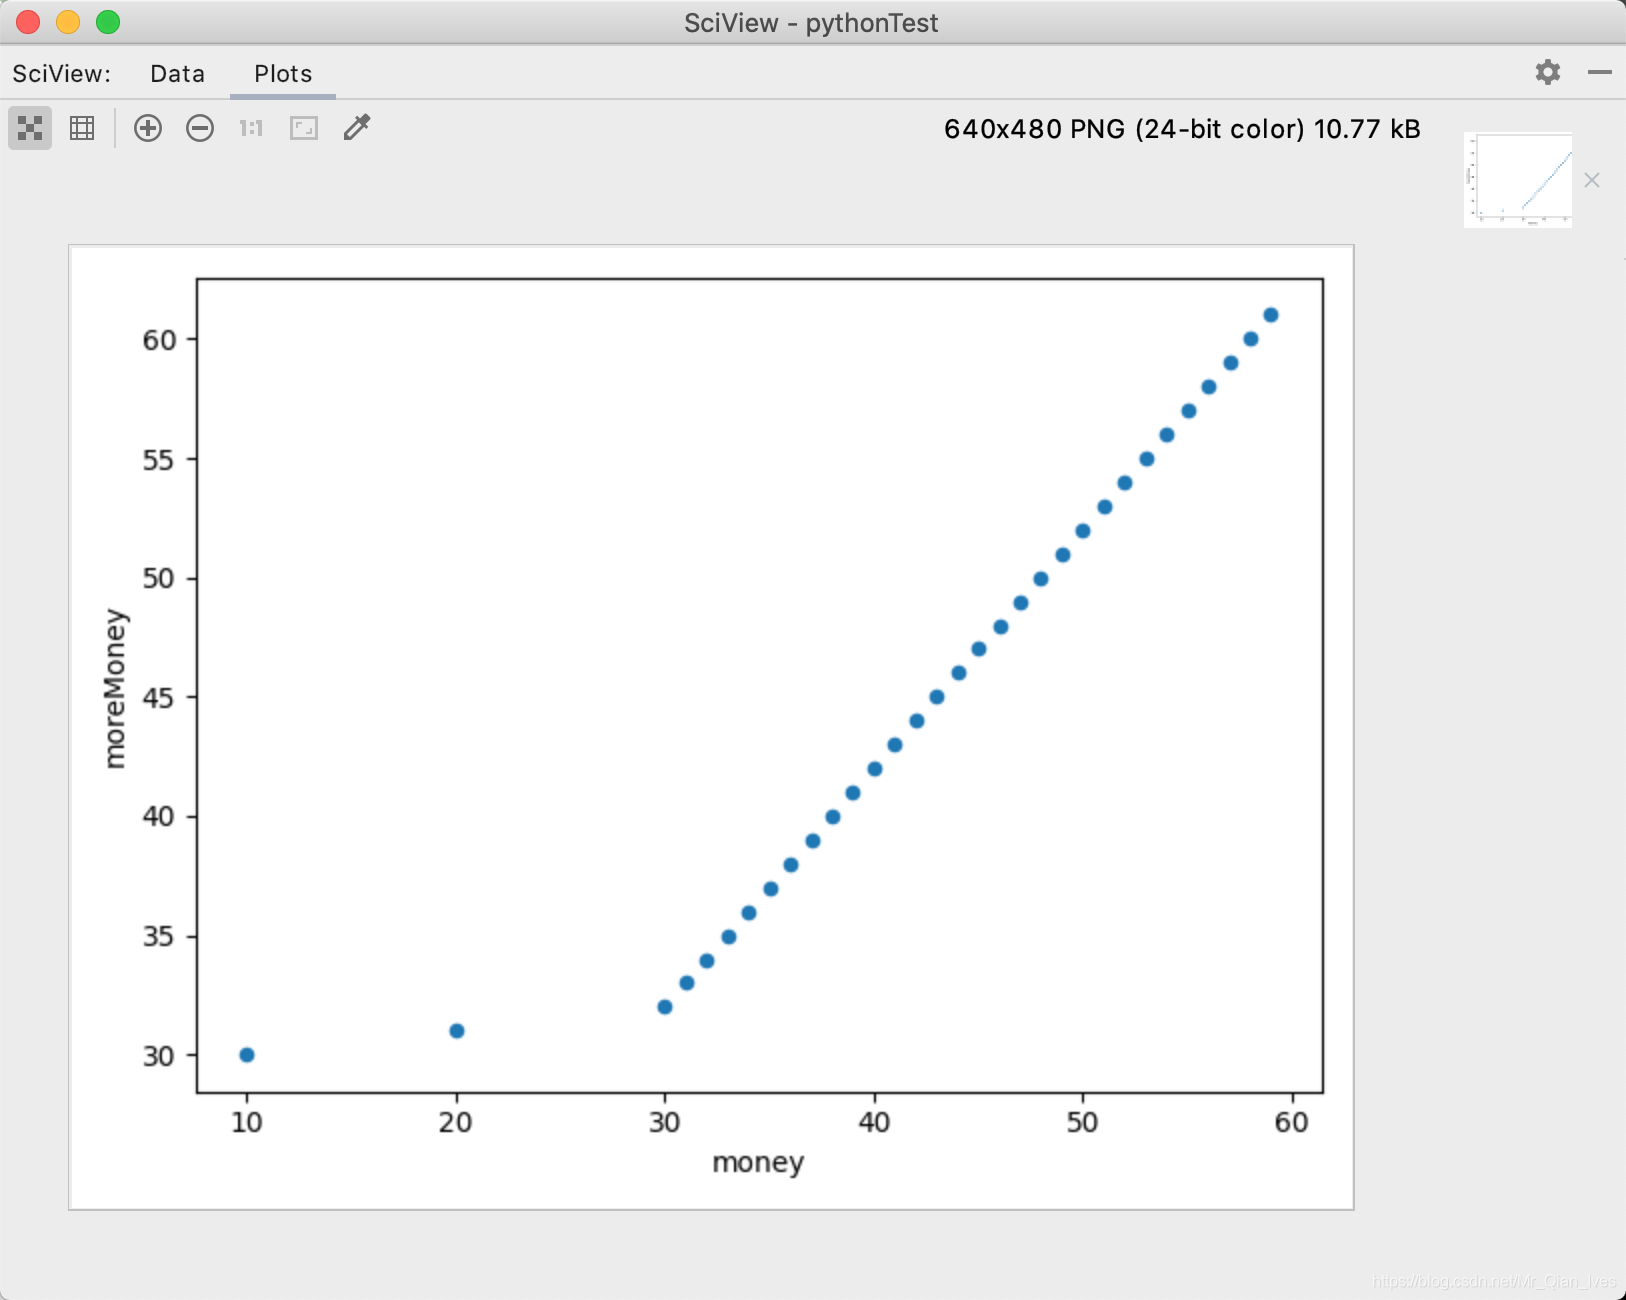
import matplotlib.pyplot as plt
import pandas as pd

# 当数据字段过多时,print不会输出全部字段  所以用下面这行代码让print输出全部字段
pd.options.display.max_columns = 777
readPah = '/Users/apple/Desktop/test.xlsx'
scatterShape = pd.read_excel(readPah, index_col='name')
print(scatterShape)
# 散点图是scatter
scatterShape.plot.scatter(x='money', y='moreMoney')
plt.show()
直方图

import matplotlib.pyplot as plt
import pandas as pd

# 当数据字段过多时,print不会输出全部字段  所以用下面这行代码让print输出全部字段
pd.options.display.max_columns = 777
readPah = '/Users/apple/Desktop/test.xlsx'
squareShape = pd.read_excel(readPah, index_col='name')
# bins越大 分割数越多  越细
squareShape.money.plot.hist(bins=10)
# 设置x轴标签
plt.xticks(range(0,max(squareShape.index),5),fontsize=20,rotation=90)
plt.show()
print(squareShape)
密度图
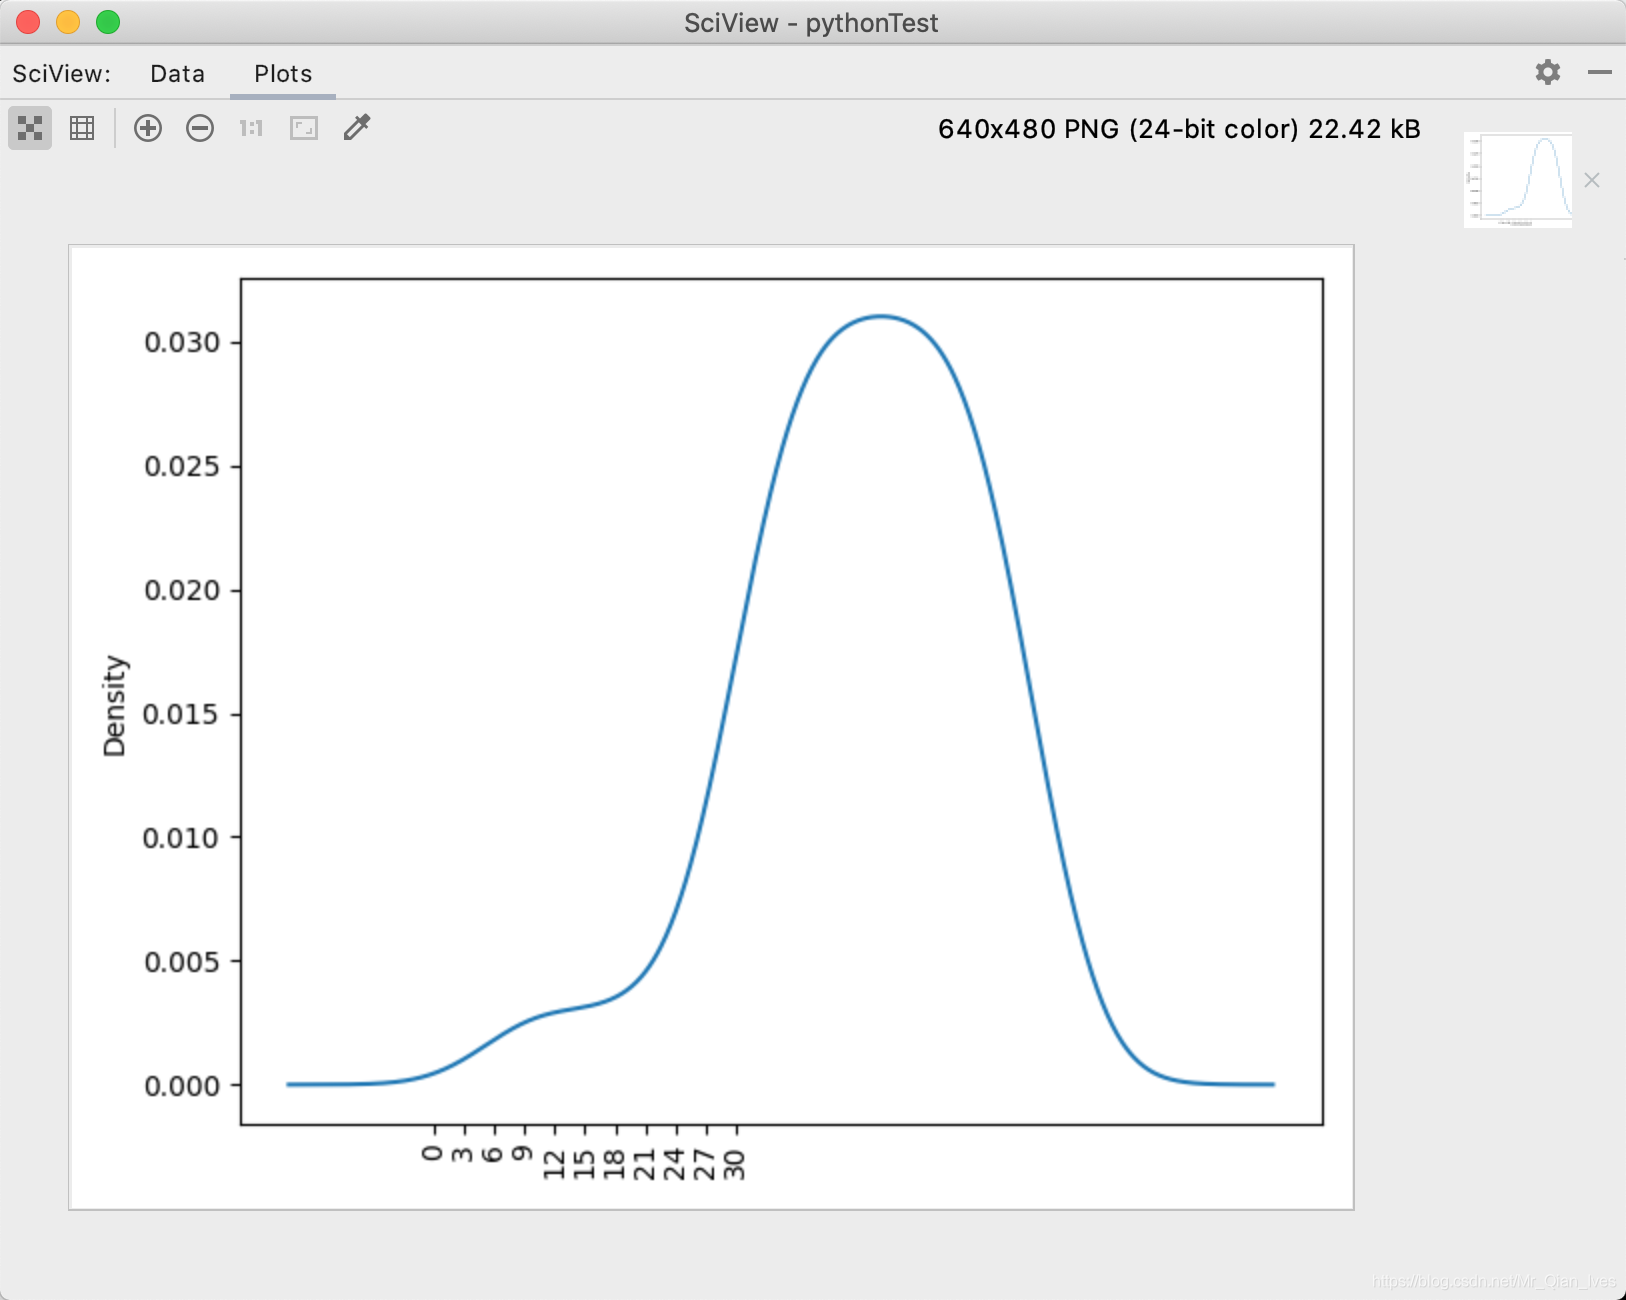
# 当数据字段过多时,print不会输出全部字段  所以用下面这行代码让print输出全部字段
pd.options.display.max_columns = 777
readPah = '/Users/apple/Desktop/test.xlsx'
kdeShape = pd.read_excel(readPah, index_col='name')
# 密度图是kde
kdeShape.money.plot.kde()
# 设置x轴标签
plt.xticks(range(0, max(kdeShape.index), 3), fontsize=10, rotation=90)
plt.show()
print(kdeShape)
数据相关性
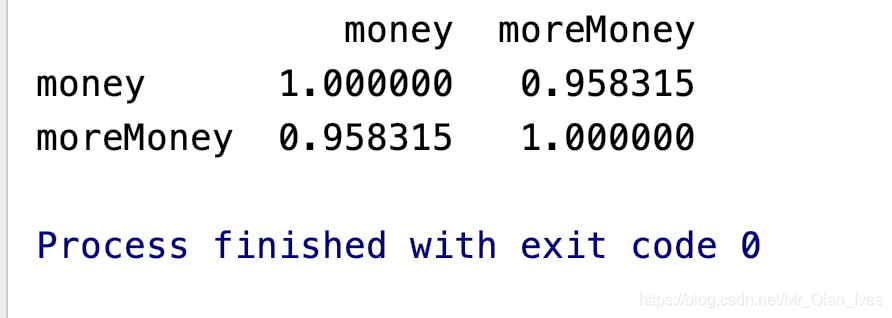
import matplotlib.pyplot as plt
import pandas as pd

# 当数据字段过多时,print不会输出全部字段  所以用下面这行代码让print输出全部字段
pd.options.display.max_columns = 777
readPah = '/Users/apple/Desktop/test.xlsx'
re = pd.read_excel(readPah, index_col='name')
# 展示每列数据之间的相关性   是否呈线性相关
print(re.corr())
多表联合(merge和join)

import pandas as pd

# 当数据字段过多时,print不会输出全部字段  所以用下面这行代码让print输出全部字段
pd.options.display.max_columns = 777
readPah = '/Users/apple/Desktop/test.xlsx'
sheet1 = pd.read_excel(readPah, index_col='name', sheet_name='Sheet1')
sheet2 = pd.read_excel(readPah, index_col='name', sheet_name='Sheet2')
# print(sheet1)
# print(sheet2)
'''
1、merge 的使用相当于Excel中的vlookup函数
2、在这里只介绍:自主设置index_col的情况
3、how的作用:假设左边三列  右边五列 how='left' 结果只有三列  how='right' 结果只有五列
4、left_on 和right_on 是联合的列
5、fillna(0)把值为na的数据填充为0
'''
#
# allSheet=sheet1.merge(sheet2,how='left',left_on=sheet1.index,right_on=sheet2.index).fillna(0)
# # 把数据类型改为int
# allSheet.mergeMoney=allSheet.mergeMoney.astype(int)

'''
1、join没有 left_on 和right_on   只有on  也就是说 联合的列名要相等
'''
allSheet=sheet1.join(sheet2,how='left',on='name').fillna(0)
# 把数据类型改为int
allSheet.mergeMoney=allSheet.mergeMoney.astype(int)

print(allSheet)
数据值的检测
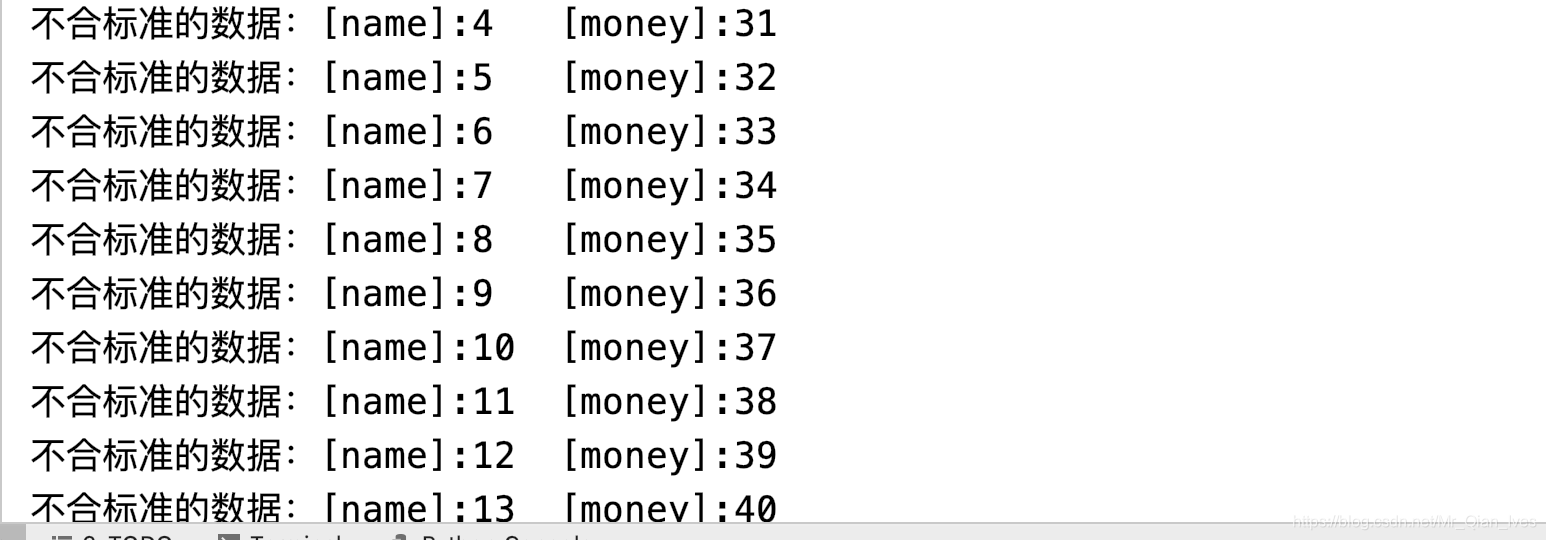
import pandas as pd

# 数据检测函数
def checkInvalidData(row):
    try:
        assert 30 >= row.money >= 10
    except:
        print(f'不合标准的数据:[name]:{row.name}\t[money]:{row.money}')


# 当数据字段过多时,print不会输出全部字段  所以用下面这行代码让print输出全部字段
pd.options.display.max_columns = 777
readPah = '/Users/apple/Desktop/test.xlsx'
re = pd.read_excel(readPah, index_col='name')
# axis=1:代表数据横向检查(一行一行检查)
# 检测数据
re.apply(checkInvalidData, axis=1)
姓名列转换成姓列和名列(一列分两列)
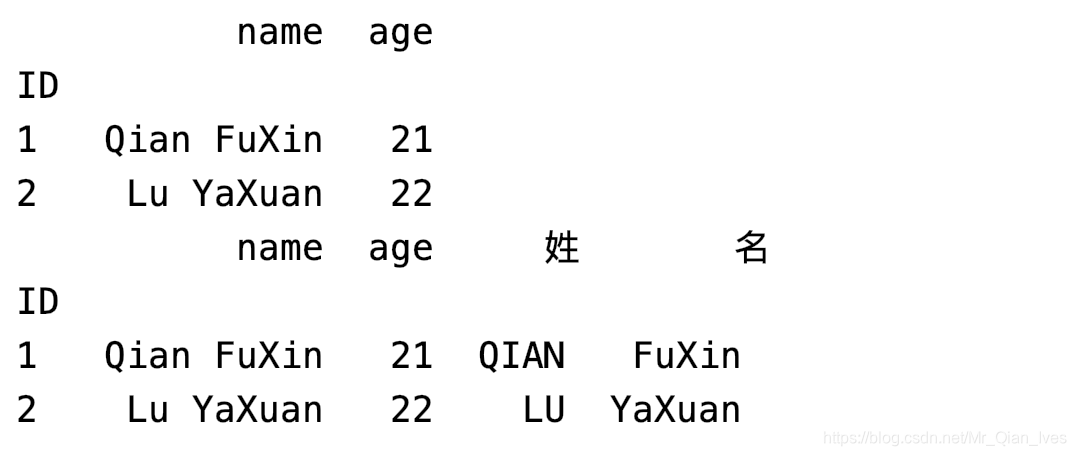
import pandas as pd

pd.options.display.max_columns = 777
readPah = '/Users/apple/Desktop/test.xlsx'
re = pd.read_excel(readPah, sheet_name='Sheet2', index_col='ID')
print(re)
# expand的作用是把分割后的列汇总
df = re.name.str.split(" ", expand=True)
# 生成新的列
# 姓的拼接全大写
re["姓"] = df[0].str.upper()
re["名"] = df[1]
print(re)
数列值的总和、平均值等操作
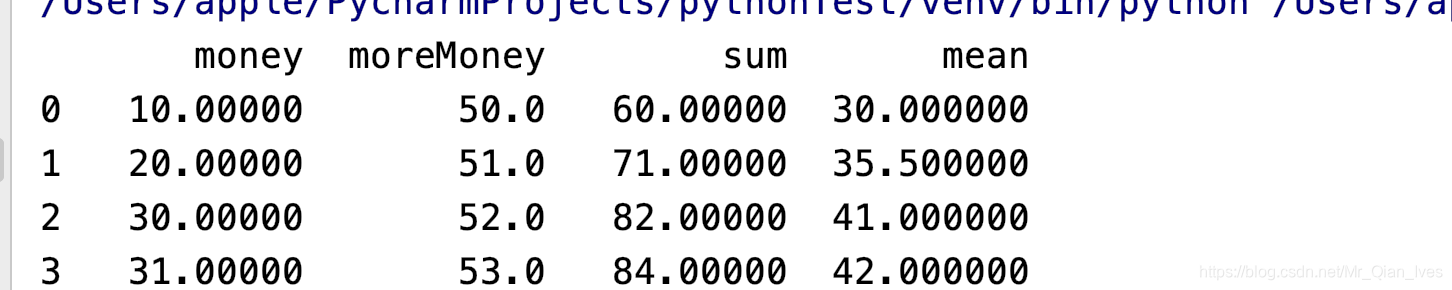
import pandas as pd

pd.options.display.max_columns = 777
readPah = '/Users/apple/Desktop/test.xlsx'
re = pd.read_excel(readPah, sheet_name='Sheet1', index_col='ID')
# 把需要计算的列取出来
aboutMoney = re[['money', 'moreMoney']]

# axis=1的作用是横式计算(从左往右)   axis=0的作用是列式计算(从上往下)   默认列式计算
# mean 是average的意思
row_mean = aboutMoney.mean(axis=1)
# 总和
row_sum = aboutMoney.sum(axis=1)
# 增加列
re['sum'] = row_sum
re['mean'] = row_mean
# 增加行
col_mean = re[['money', 'moreMoney', 'sum', 'mean']].mean()
re = re.append(col_mean, ignore_index=True)
print(re)
重复数据的查找和去除

import pandas as pd

pd.options.display.max_columns = 777
readPah = '/Users/apple/Desktop/test.xlsx'
re = pd.read_excel(readPah, sheet_name='Sheet1', index_col='ID')
# 查看重复的数据
result = re.duplicated(subset='money')
result = result[result == True]
# iloc是indexLocation的意思  根据index得到数据
print('重复的数据')
print(re.iloc[result.index])
# 去除重复数据
# subset的作用是设置哪一列不能出现重复数据
# keep的作用是保留哪个重复数据,开始的数据或结尾的数据
re.drop_duplicates(subset='money', inplace=True, keep='last')
print('清楚重复数据后的表格')
print(re)
行列颠倒(行转列,列转行)

import pandas as pd

pd.options.display.max_columns = 777
readPah = '/Users/apple/Desktop/test.xlsx'
re = pd.read_excel(readPah, sheet_name='Sheet1', index_col='ID')
# 行列颠倒  transpose
result=re.transpose()
print(result)
读取不同格式的文件
import pandas as pd
# 无论是csv(默认逗号分割)、tsv(\tab分割)、txt(文本)都可以用read_csv  sep 是分割符 index_col是指定索引
pd.read_csv('',sep='',index_col='')
数据透视表
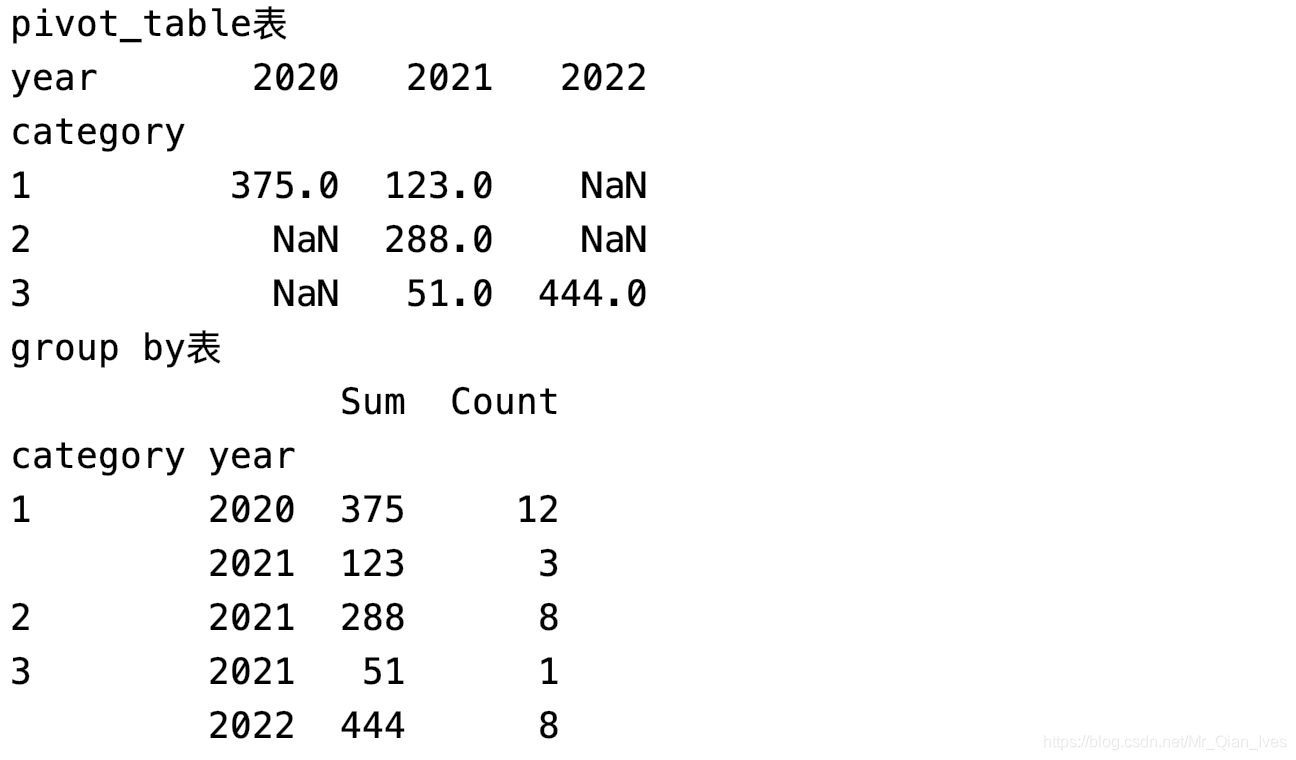
import numpy as np
import pandas as pd

pd.options.display.max_columns = 777
readPah = '/Users/apple/Desktop/test.xlsx'
re = pd.read_excel(readPah, sheet_name='Sheet1', index_col='ID')

# 从时间里取年份
re['year'] = pd.DatetimeIndex(re.time).year

# index 相当于rows 是行  columns是列  values 是行列交叉的点的值  aggfunc是对于交叉点值有什么要求
# 透视表 就是行列交叉得到对应的值
# 分类和年份对应money的值 money的什么值呢   sum值

p1 = re.pivot_table(index='category', columns='year', values='money', aggfunc=np.sum)
print('pivot_table表')
print(p1)

# 分组  group by  按组查询  mysql附体
# 透视表是行列交叉   第一行第一列得到某个值
# groupby是列列得值  第一行第一列第二列得到某个值
gb = re.groupby(['category', 'year'])
# 得到sum 和count
s = gb.money.sum()
c = gb.money.count()
re2 = pd.DataFrame({'Sum': s, 'Count': c})
print('group by表')
print(re2)
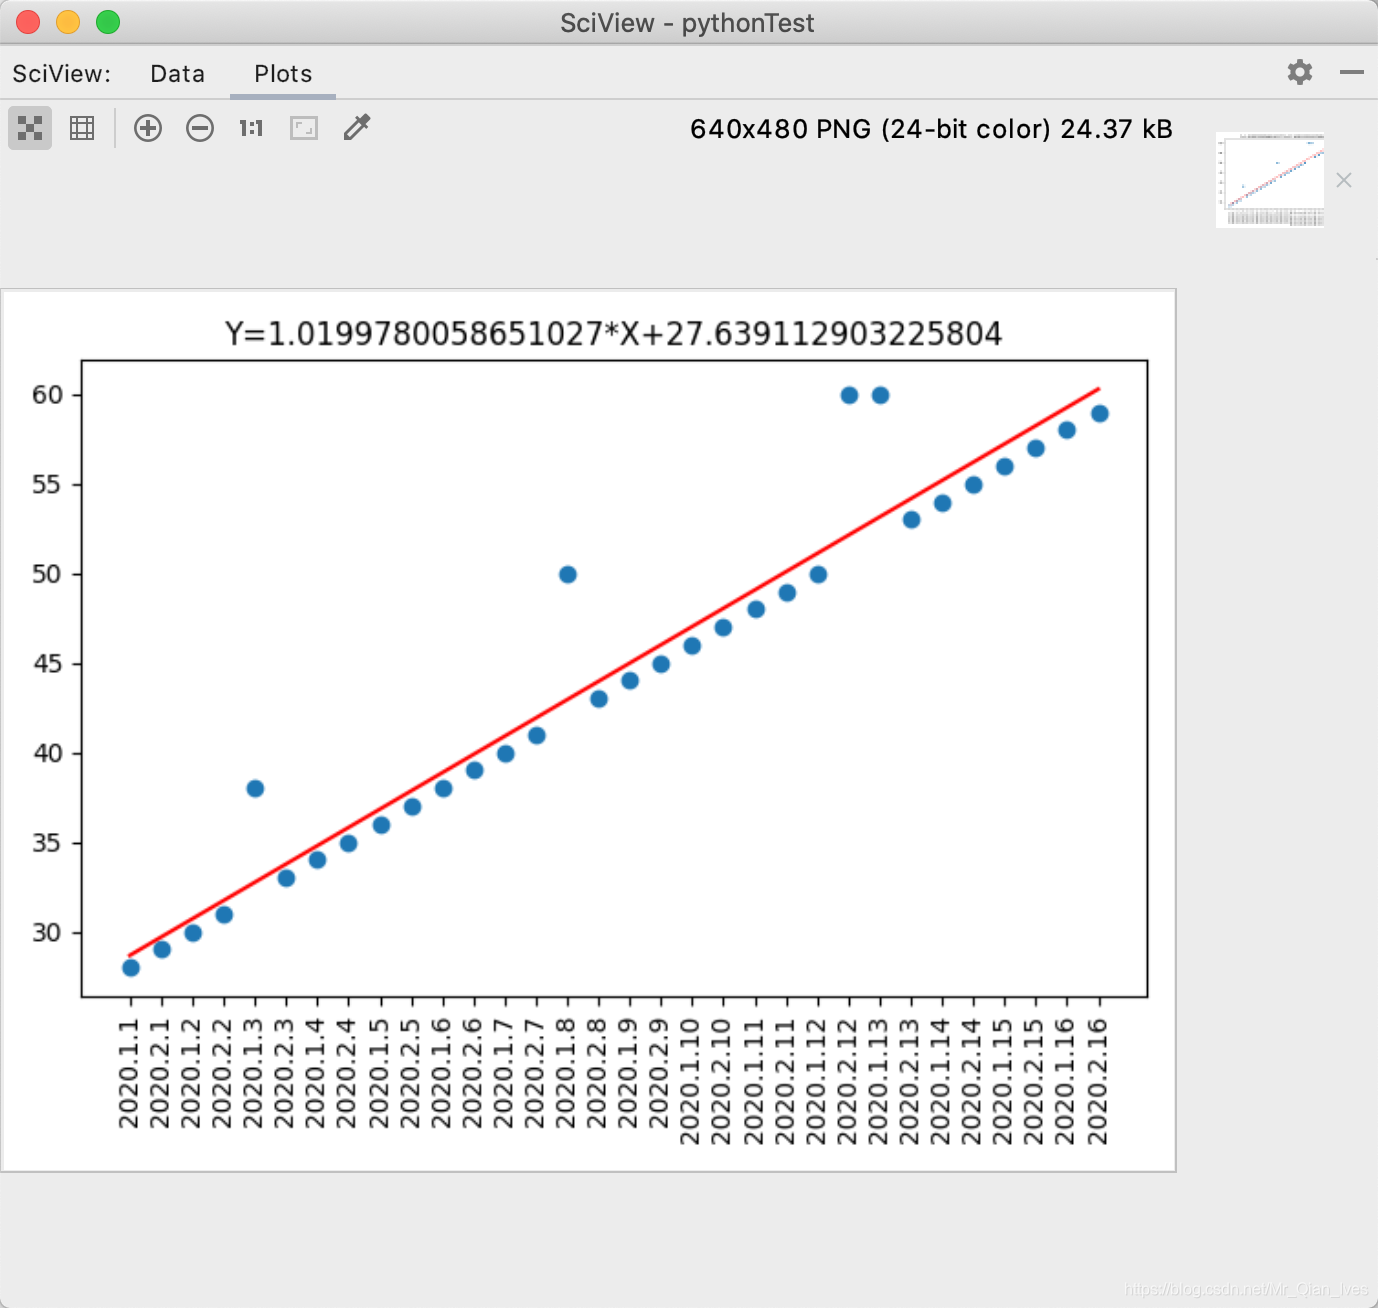
线性回归预测数据
import matplotlib.pyplot as plt
# import numpy as np
import pandas as pd
# scipy是科学计算包  调用其中的线性回归包
from scipy.stats import linregress

pd.options.display.max_columns = 777
readPah = '/Users/apple/Desktop/test.xlsx'
# 把时间这一列 作为str类型
re = pd.read_excel(readPah, sheet_name='Sheet1', index_col='ID', dtype={'time': str})

'''
    每个参数的作用
 slope : float  斜率
        Slope of the regression line.
    intercept : float  截距
        Intercept of the regression line.
    rvalue : float   相关系数
        Correlation coefficient.
    pvalue : float   暂时不明白这个参数的意思
        Two-sided p-value for a hypothesis test whose null hypothesis is
        that the slope is zero, using Wald Test with t-distribution of
        the test statistic.
    stderr : float  标准误差
        Standard error of the estimated gradient.
'''
# 斜率、截距、相关系数、pvalue、标准误差
slope, intercept, rvalue, pvalue, stderr = linregress(re.index, re.money)

# 得到预测值
exceptionValue=slope*re.index+intercept

# 调用散点图图
plt.scatter(re.index, re.money)

# 调用折线图
plt.plot(re.index,exceptionValue,color='red')
# 设置标题
plt.title('Y='+str(slope)+'*X+'+str(intercept))
#  设置x标签  用时间替换index的x轴
plt.xticks(re.index, re.time, rotation=90)
# 布局调整
plt.tight_layout()
# 斜率和截距都有了  只要给出x值就可以求出y值  简称预测数据
plt.show()
Jupyter实现条件格式化(数据上色)
Jupyter的安装和使用
1.pycharm搜索Jupyter库并下载
2.对pycharm的终端输入 python -m IPython notebook
3.跳转页面后
源码和成果预览
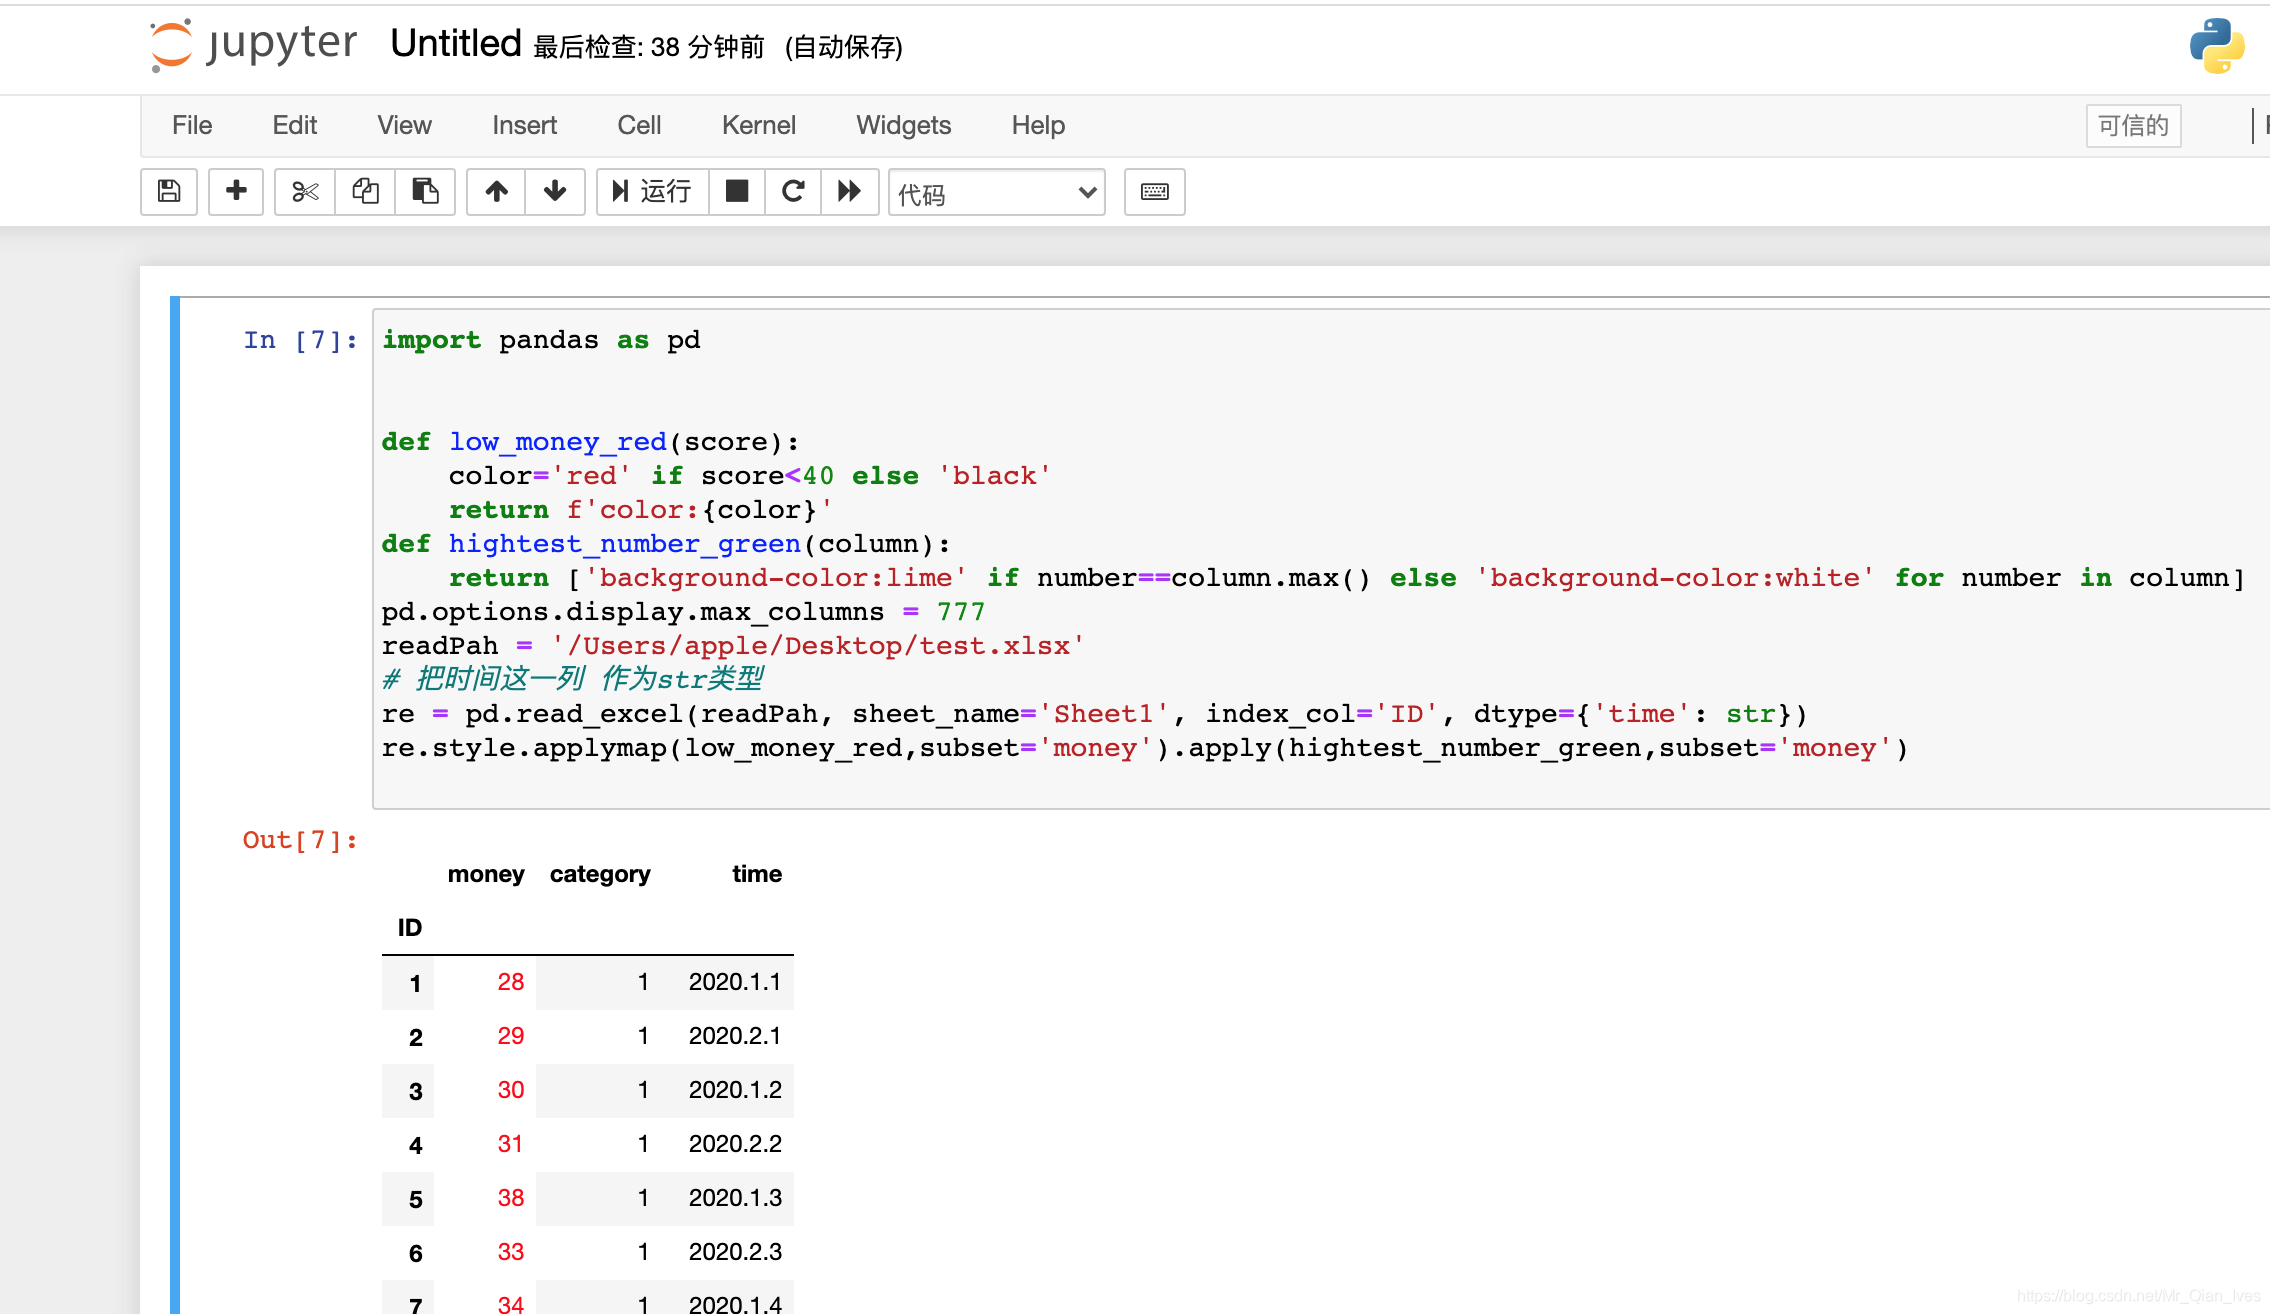
import pandas as pd

# 低于40分上红色
def low_money_red(score):
    color='red' if score<40 else 'black'
    return f'color:{color}'
#每列最高分上绿色背景
def hightest_number_green(column):
    return ['background-color:lime' if number==column.max() else 'background-color:white' for number in column]
pd.options.display.max_columns = 777
readPah = '/Users/apple/Desktop/test.xlsx'
# 把时间这一列 作为str类型
re = pd.read_excel(readPah, sheet_name='Sheet1', index_col='ID', dtype={'time': str})
# apply传递的是以series为基本单位,行或者列;applymap传递的是一个元素,dataframe最基本单元
re.style.applymap(low_money_red,subset='money').apply(hightest_number_green,subset='money')
Jupyter实现条件格式化(颜色深浅)
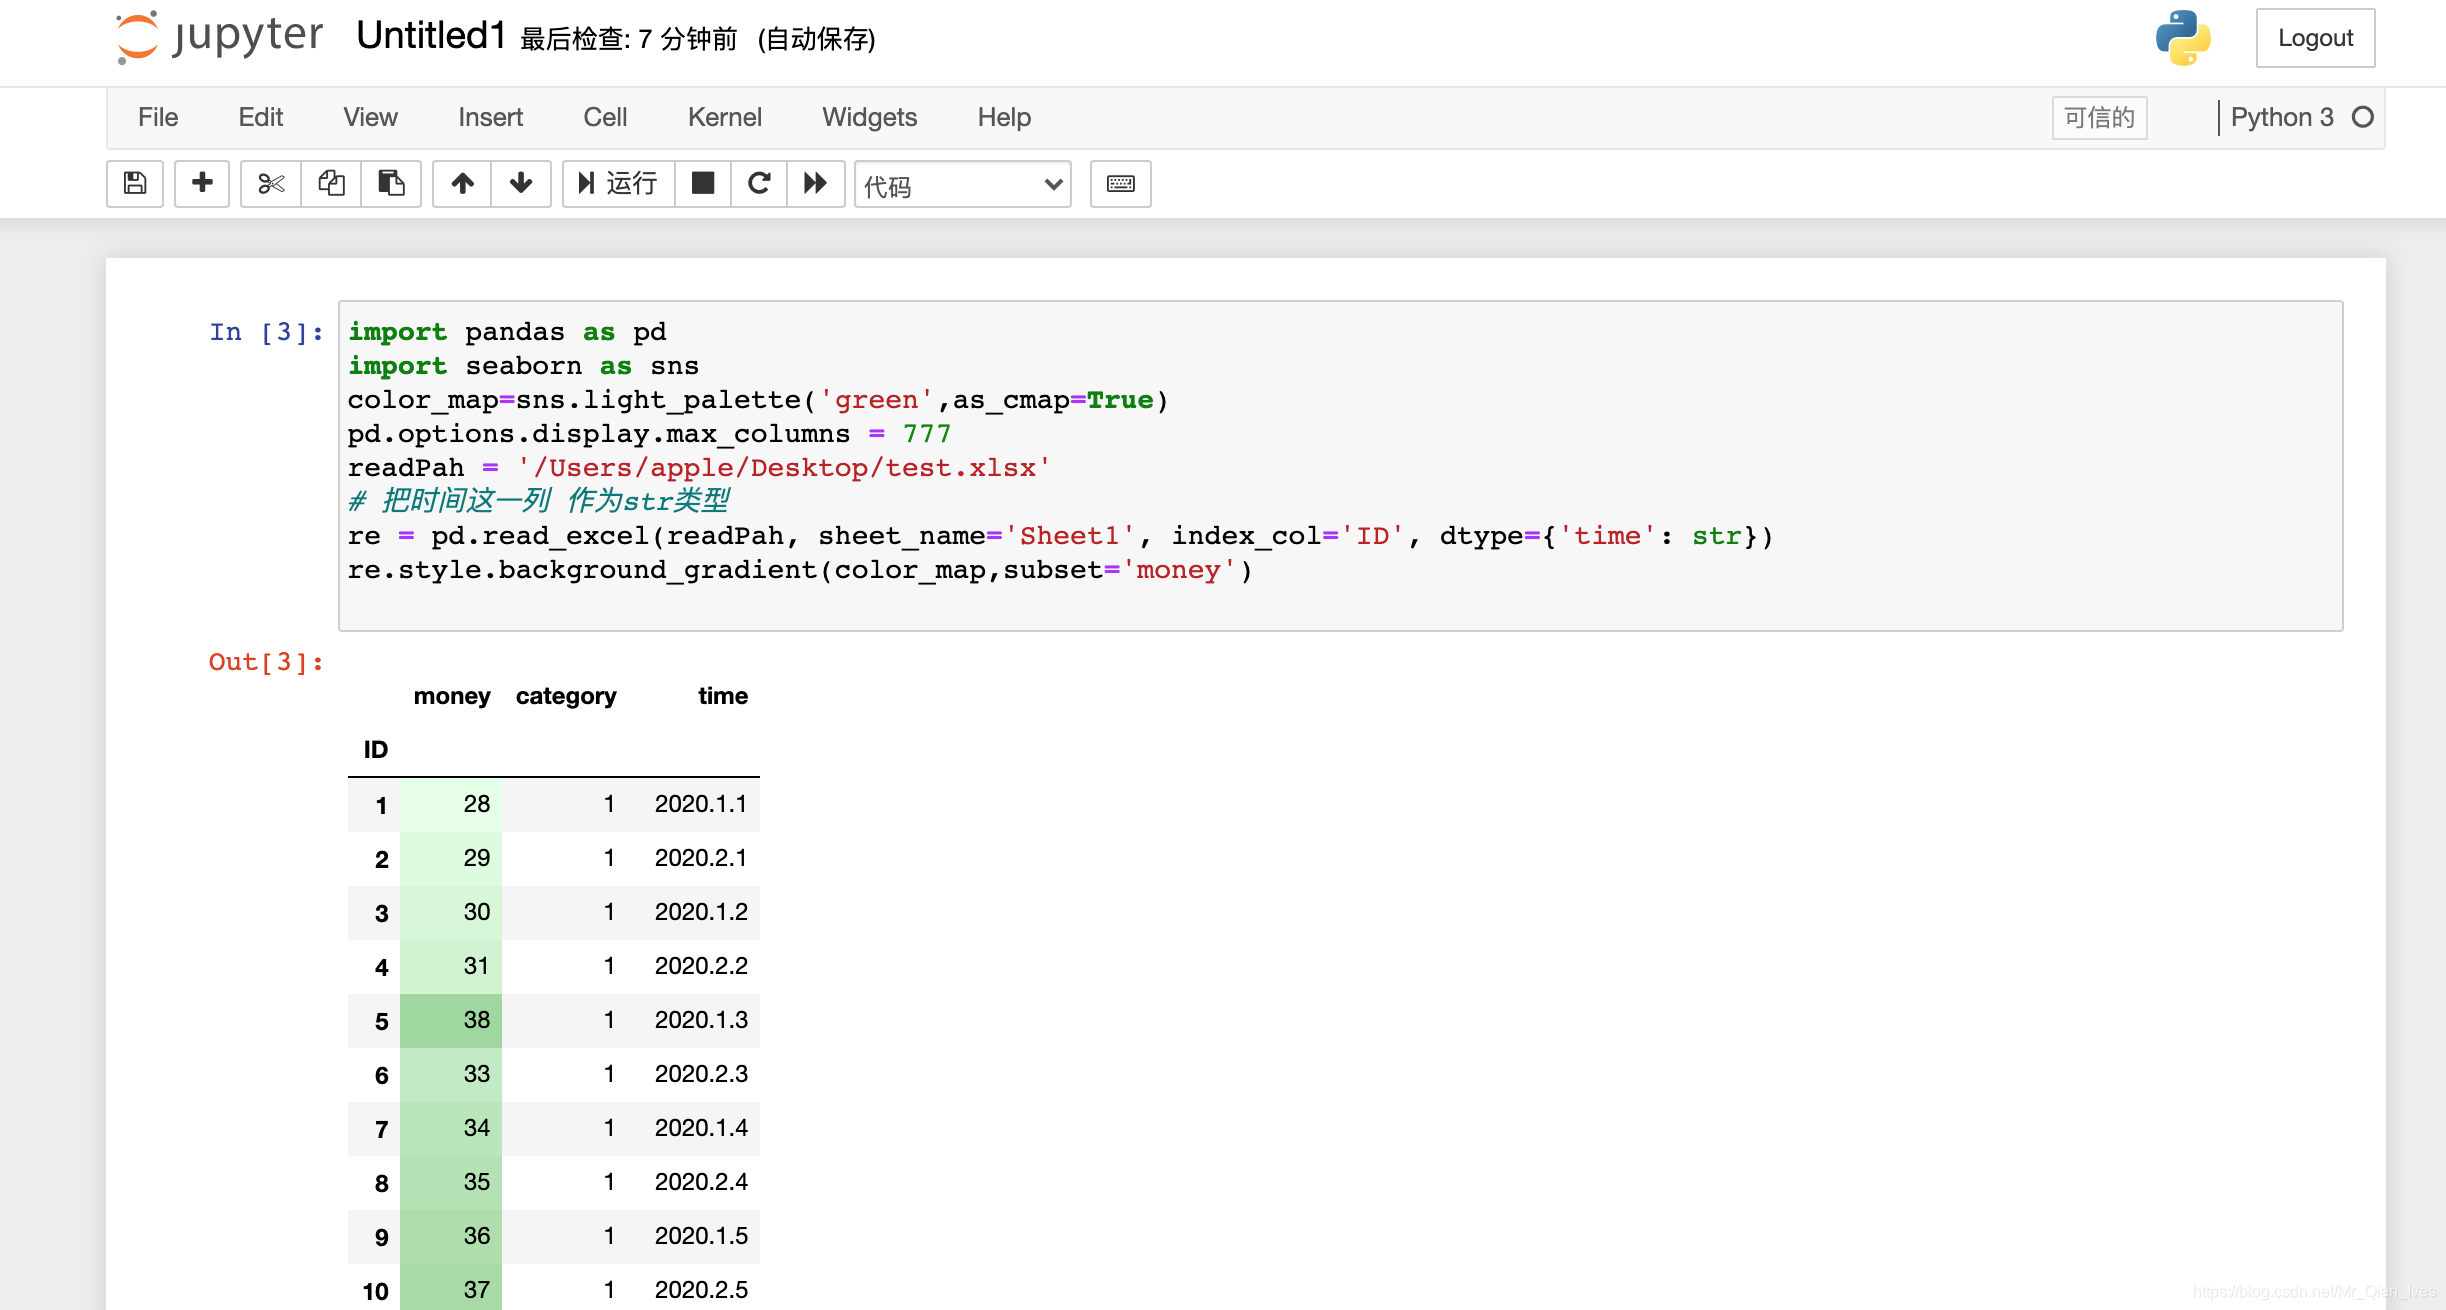
import pandas as pd
import seaborn as sns
# 设置面板颜色
color_map=sns.light_palette('green',as_cmap=True)
pd.options.display.max_columns = 777
readPah = '/Users/apple/Desktop/test.xlsx'
# 把时间这一列 作为str类型
re = pd.read_excel(readPah, sheet_name='Sheet1', index_col='ID', dtype={'time': str})
# 设置背景颜色陡度
re.style.background_gradient(color_map,subset='money')
Jupyter实现条件格式化(进度条)
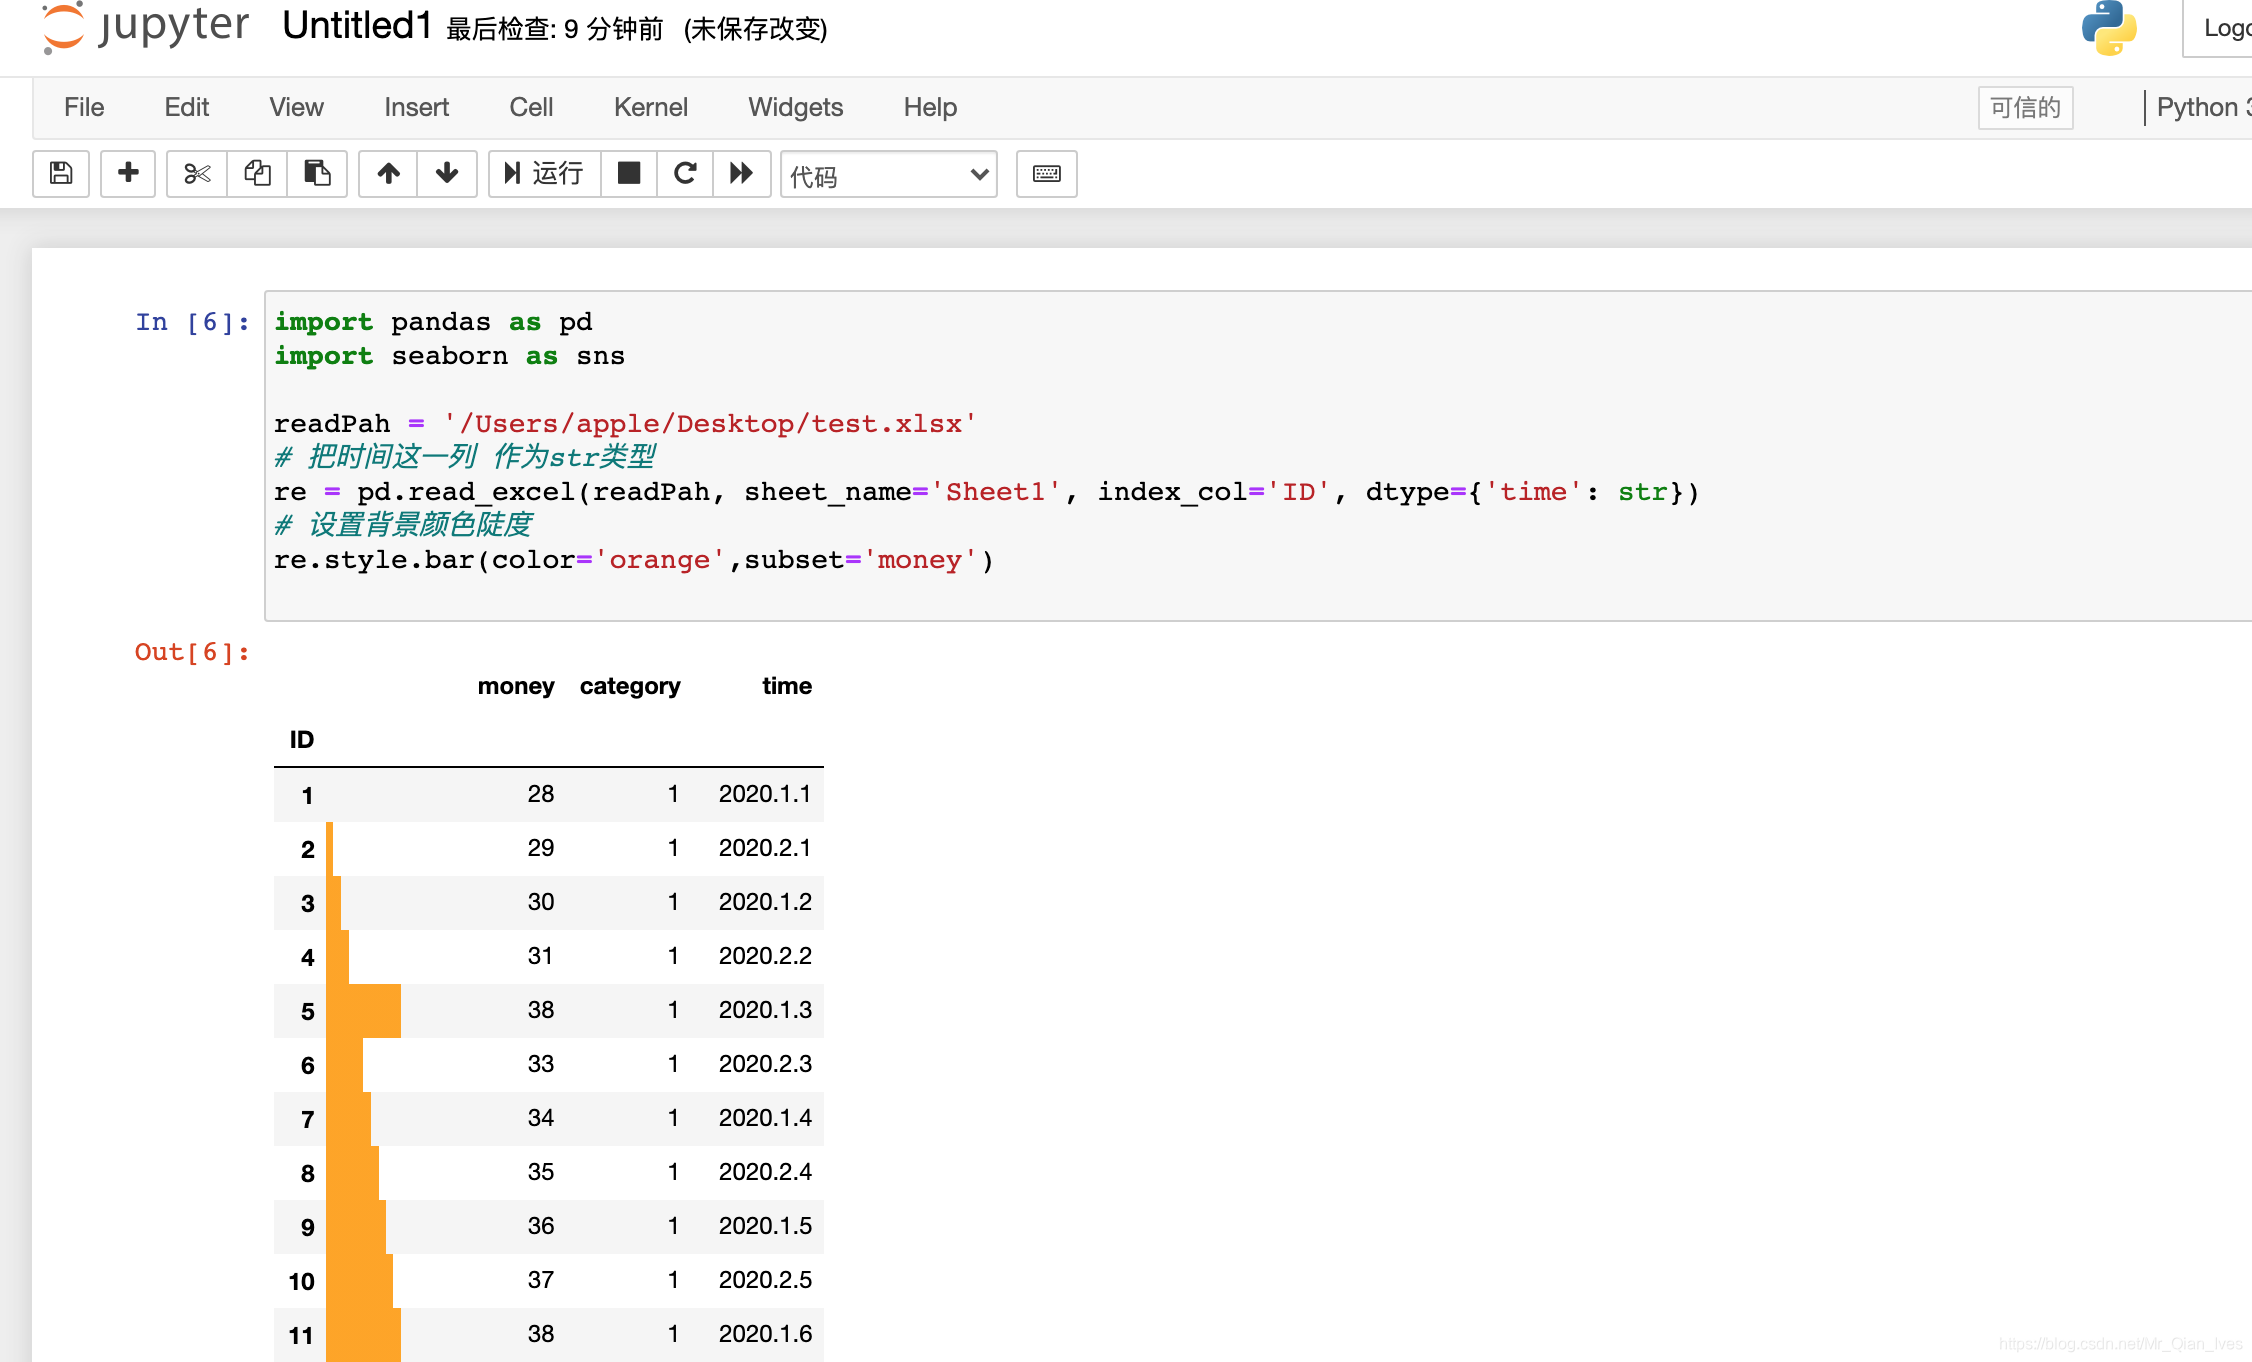
import pandas as pd
import seaborn as sns

readPah = '/Users/apple/Desktop/test.xlsx'
# 把时间这一列 作为str类型
re = pd.read_excel(readPah, sheet_name='Sheet1', index_col='ID', dtype={'time': str})
# 设置进度条颜色
re.style.bar(color='orange',subset='money')
pandas和数据库
import pandas
import pymysql

# 设置本地mysql信息
conn = pymysql.connect(
    host="localhost",
    user="root",
    password="123456",
    database="QianFuxin",
    charset="utf8")
# 设置sql语句
sql = 'select * from job'
# 数据查询并转为DF
job = pandas.read_sql_query(sql, conn)
# 打印数据
print(job.head(100))
复杂编程(函数)

import pandas as pd


# 金钱乘于种类的平方
def moneyMultiplyCategory(money, category):
    return money * (category ** 2)


readPah = '/Users/apple/Desktop/test.xlsx'
re1 = pd.read_excel(readPah, sheet_name='Sheet1', dtype={'time': str})
# axis=1 按行扫描
# row是某行 row['money']是某行某列的值
# apply 是应用函数
# lamba是简易函数
re1['allMoney'] = re1.apply(lambda row: moneyMultiplyCategory(row['money'], row['category']), axis=1)

print(re1)