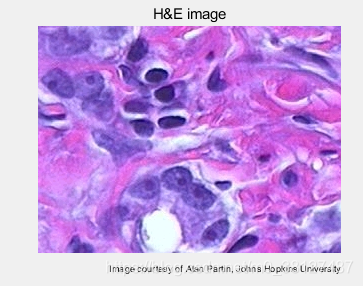
he = imread(‘hestain.png’);%读取图像
figure; imshow(he), %显示
title(‘H&E image’);
text(size(he,2),size(he,1)+15,…
‘Image courtesy of Alan Partin, Johns Hopkins University’, …
‘FontSize’,7,‘HorizontalAlignment’,‘right’);
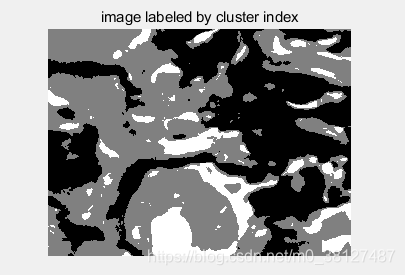
cform = makecform(‘srgb2lab’);%rgb空间转换成Lab空间的结构
lab_he = applycform(he,cform);%rgb空间转换成Lab空间
ab = double(lab_he(:,:,2:3));
nrows = size(ab,1); ncols = size(ab,2);
ab = reshape(ab,nrows*ncols,2);
nColors = 3;
[cluster_idx cluster_center] = kmeans(ab,nColors,‘distance’,…
‘sqEuclidean’, ‘Replicates’,3);%进行K均值聚类
pixel_labels = reshape(cluster_idx,nrows,ncols);
figure; imshow(pixel_labels,[]), %显示聚类分割成的三部分
title(‘image labeled by cluster index’);
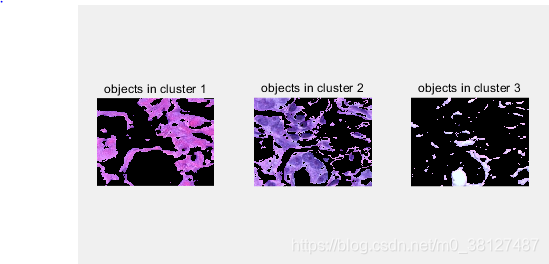
segmented_images = cell(1,3);
rgb_label = repmat(pixel_labels,[1 1 3]);
for k = 1:nColors
color = he;
color(rgb_label ~= k) = 0;%标号为k外的其他区域置0
segmented_images{k} = color;
end
figure; subplot(131)
imshow(segmented_images{1}), %显示第一个聚类区域
title(‘objects in cluster 1’); subplot(132),
imshow(segmented_images{2}), %显示第二个聚类区域
title(‘objects in cluster 2’); subplot(133),
imshow(segmented_images{3}), %显示第三个聚类区域
title(‘objects in cluster 3’);
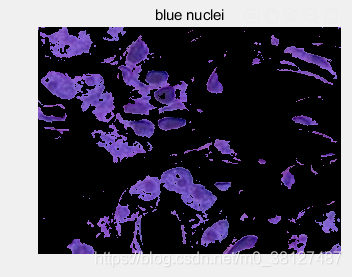
mean_cluster_value = mean(cluster_center,2);%计算均值
[tmp, idx] = sort(mean_cluster_value);%排序
blue_cluster_num = idx(1);%最小值
L = lab_he(:,:,1);%亮度分量
blue_idx = find(pixel_labels == blue_cluster_num);%蓝色区域标号
L_blue = L(blue_idx);
is_light_blue = im2bw(L_blue,graythresh(L_blue));%转化为二值图像
nuclei_labels = repmat(uint8(0),[nrows ncols]);
nuclei_labels(blue_idx(is_light_blue==false)) = 1;%深蓝区域标号
nuclei_labels = repmat(nuclei_labels,[1 1 3]);
blue_nuclei = he;
blue_nuclei(nuclei_labels ~= 1) = 0;%深蓝区域外其他区域置0
figure, imshow(blue_nuclei), %显示深蓝区域
title(‘blue nuclei’);
MATLAB图像处理之分割处理二
猜你喜欢
转载自blog.csdn.net/m0_38127487/article/details/115259638
今日推荐
周排行