依赖模块
pip install matplotlib
示例代码
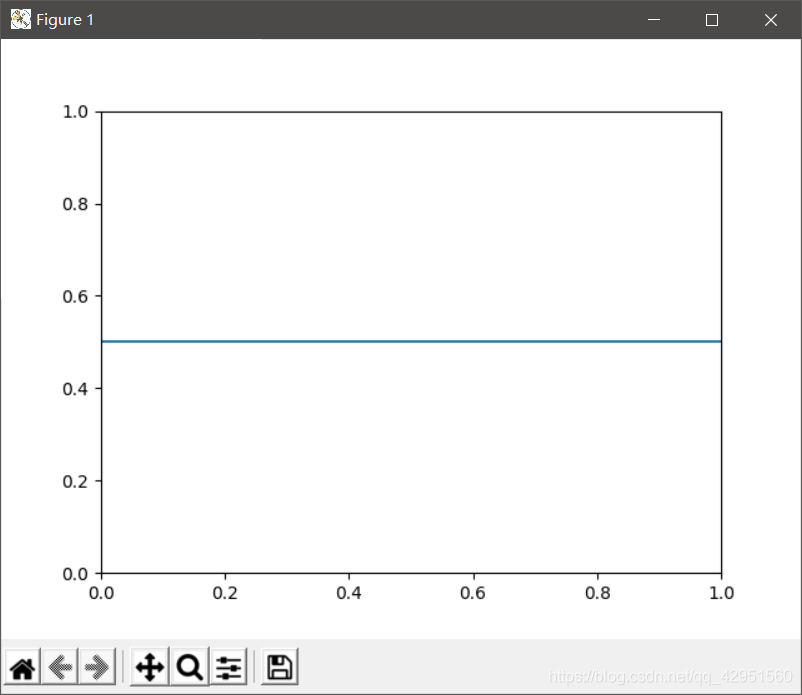
与x轴平行(水平线)
import matplotlib.pyplot as plt
plt.axhline(y=0.5)
plt.show()
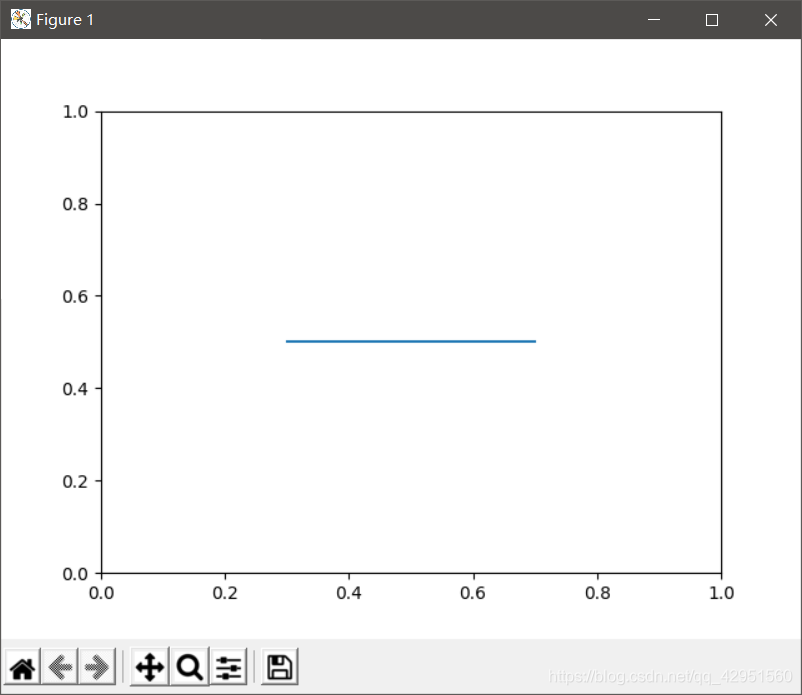
import matplotlib.pyplot as plt
plt.axhline(y=0.5, xmin=0.3, xmax=0.7)
plt.show()
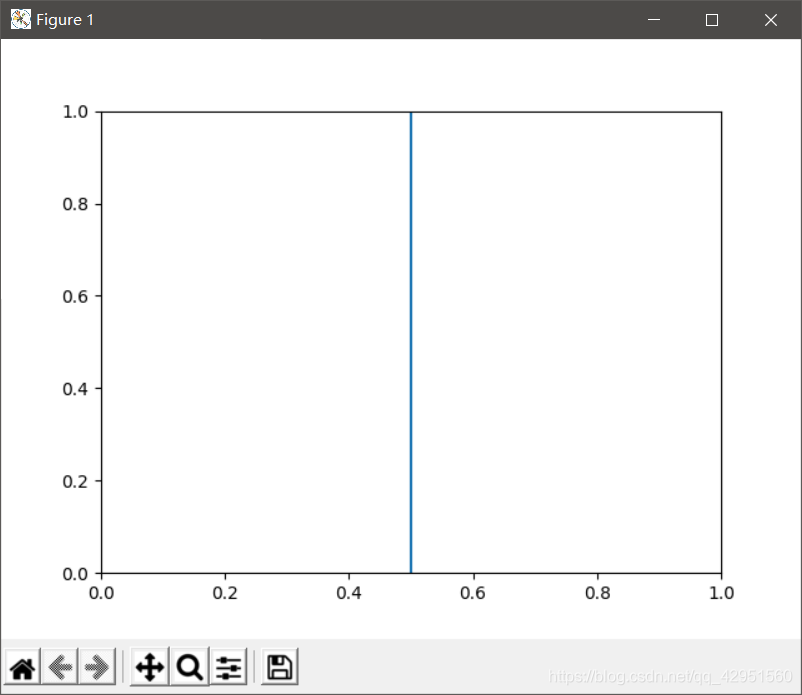
与y轴平行(竖直线)
import matplotlib.pyplot as plt
plt.axvline(x=0.5)
plt.show()
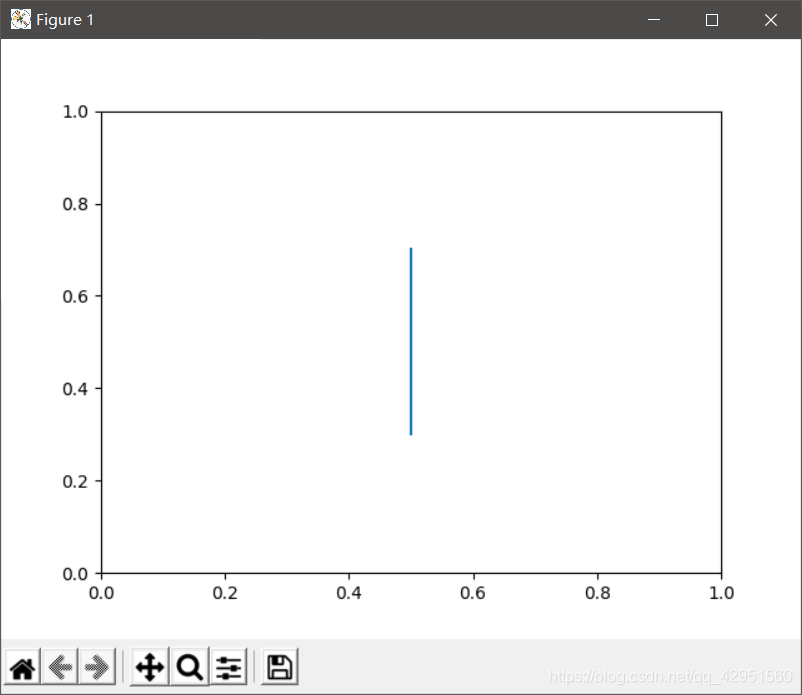
import matplotlib.pyplot as plt
plt.axvline(x=0.5, ymin=0.3, ymax=0.7)
plt.show()
引用参考
https://matplotlib.org/stable/api/_as_gen/matplotlib.pyplot.axhline.html
https://matplotlib.org/stable/api/_as_gen/matplotlib.pyplot.axvline.html