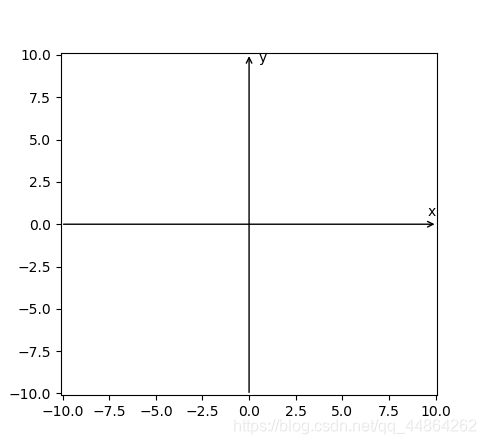
在做函数图像时,因为输出的图像总是没有坐标轴,这让我们看上去很是烦恼。我在这里用annotate给出了一个画坐标轴的办法。效果如下:
代码实现
import matplotlib.pyplot as plt
import numpy as np

x_np_list = np.arange(-10, 10, 0.01)
y_list = [0] * len(x_np_list)   # 创建元素相同的列表
plt.annotate("", xy=(10.1, 0), xycoords='data', xytext=(-10.1, 0), textcoords='data',
             arrowprops=dict(arrowstyle="->", connectionstyle="arc3"))  # 画x轴
plt.annotate("", xy=(0, 10.1), xycoords='data', xytext=(0, -10.1), textcoords='data',
             arrowprops=dict(arrowstyle="->", connectionstyle="arc3"))  # 画y轴
plt.text(9.6, 0.5, 'x')  # 标x
plt.text(0.5, 9.6, 'y')  # 标y
plt.xlim(-10.1, 10.1)
plt.ylim(-10.1, 10.1)
plt.show()
说明
这个横纵坐标轴范围还得自己调整,annotate的范围不要出界,这样可能会看不到箭头。选好范围修改参数,将代码直接粘贴就可使用。