QCustomPlot是一个基于Qt C++的图形库,用于绘制和数据可视化 - 制作漂亮的2D图 - 曲线图、趋势图、坐标图、柱状图等。
有详细的例程和帮助文档,使用方便。
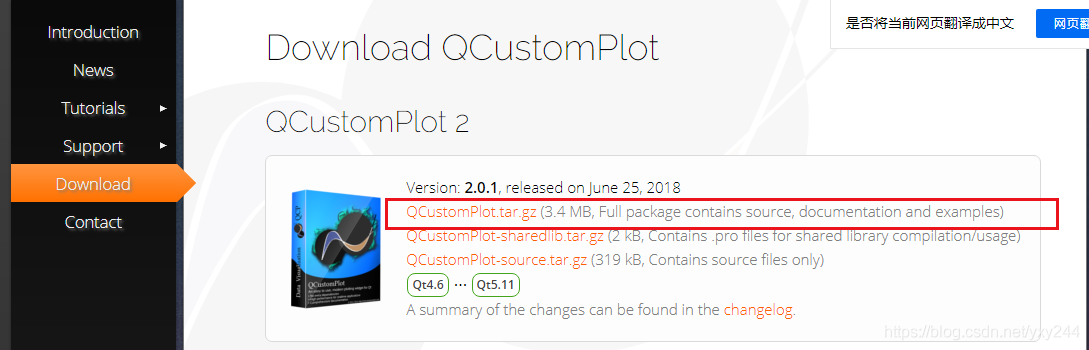
一、下载
到官网https://www.qcustomplot.com/index.php/download下载最新版本
二、安装帮助文档
1.下载后解压,有如下文档
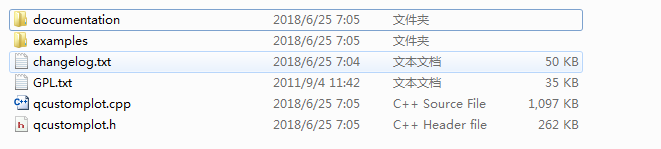
(1)帮助文档:documentation
(2)例程:examples
(3)源文件:qcustomplot.cpp和qcustomplot.h
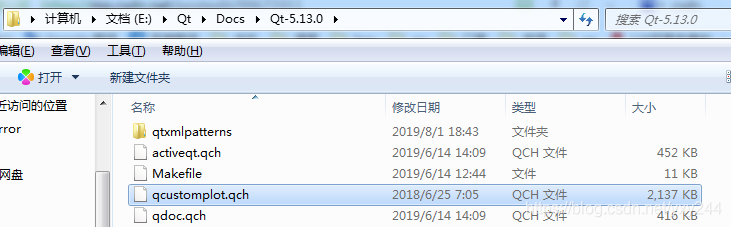
2.将帮助文档qcustomplot.qch,复制到QT目录下,例如E:\Qt\Docs\Qt-5.13.0(根据自己QT的安装位置)
 3.打开QT,工具->选项->帮助->添加
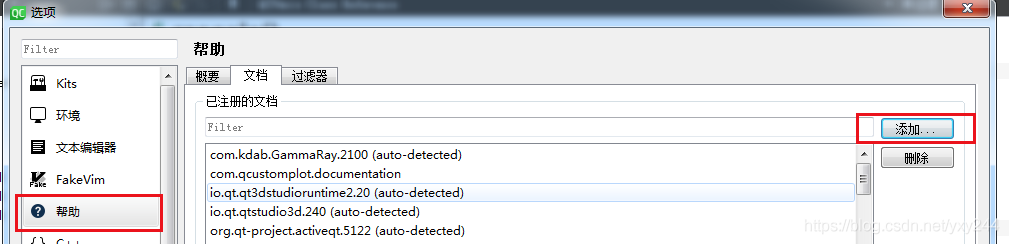 4.选择qcustomplot.qch,帮助文档就安装好了
三、测试
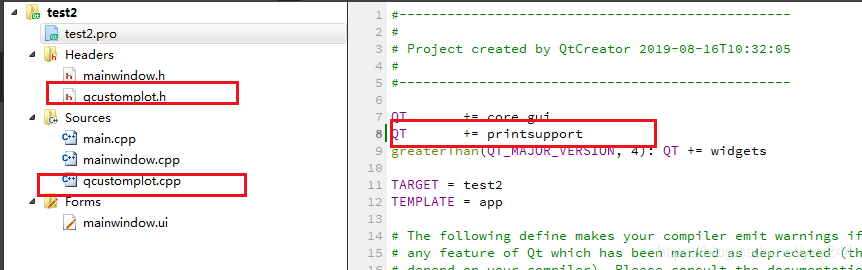
1.新建工程,customplot.cpp和qcustomplot.h复制到工程文件里,并在项目里qcustomplot.cpp和qcustomplot.h添加进来,.pro里添加
QT += printsupport
2.打开.ui文件,拖入一个widget控件,右键提升
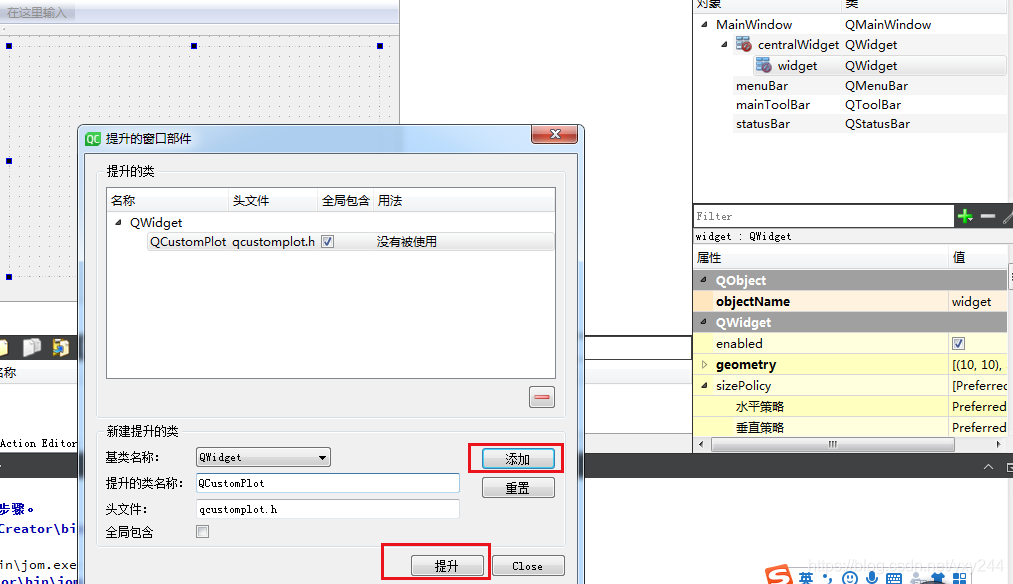 3.输入QcustomPlot,点添加,再点提升,编译一下,看有没错误。
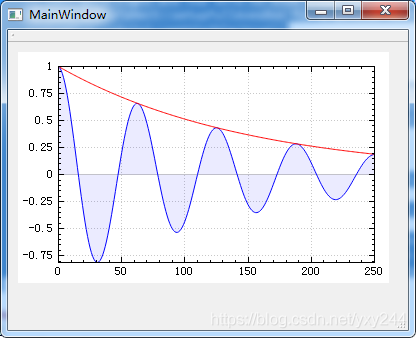
4.在构造函数里添加测试代码
MainWindow::MainWindow(QWidget *parent) :
    QMainWindow(parent),
    ui(new Ui::MainWindow)
{


    ui->setupUi(this);

    QCustomPlot* customPlot  = ui->customPlot;
    // add two new graphs and set their look:
    customPlot->addGraph();
    customPlot->graph(0)->setPen(QPen(Qt::blue)); // line color blue for first graph
    customPlot->graph(0)->setBrush(QBrush(QColor(0, 0, 255, 20))); // first graph will be filled with translucent blue
    customPlot->addGraph();
    customPlot->graph(1)->setPen(QPen(Qt::red)); // line color red for second graph
    // generate some points of data (y0 for first, y1 for second graph):
    QVector<double> x(251), y0(251), y1(251);
    for (int i=0; i<251; ++i)
    {


      x[i] = i;
      y0[i] = qExp(-i/150.0)*qCos(i/10.0); // exponentially decaying cosine
      y1[i] = qExp(-i/150.0);              // exponential envelope
    }
    // configure right and top axis to show ticks but no labels:
    // (see QCPAxisRect::setupFullAxesBox for a quicker method to do this)
    customPlot->xAxis2->setVisible(true);
    customPlot->xAxis2->setTickLabels(false);
    customPlot->yAxis2->setVisible(true);
    customPlot->yAxis2->setTickLabels(false);
    // make left and bottom axes always transfer their ranges to right and top axes:
    connect(customPlot->xAxis, SIGNAL(rangeChanged(QCPRange)), customPlot->xAxis2, SLOT(setRange(QCPRange)));
    connect(customPlot->yAxis, SIGNAL(rangeChanged(QCPRange)), customPlot->yAxis2, SLOT(setRange(QCPRange)));
    // pass data points to graphs:
    customPlot->graph(0)->setData(x, y0);
    customPlot->graph(1)->setData(x, y1);
    // let the ranges scale themselves so graph 0 fits perfectly in the visible area:
    customPlot->graph(0)->rescaleAxes();
    // same thing for graph 1, but only enlarge ranges (in case graph 1 is smaller than graph 0):
    customPlot->graph(1)->rescaleAxes(true);
    // Note: we could have also just called customPlot->rescaleAxes(); instead
    // Allow user to drag axis ranges with mouse, zoom with mouse wheel and select graphs by clicking:
    customPlot->setInteractions(QCP::iRangeDrag | QCP::iRangeZoom | QCP::iSelectPlottables);
}
5.运行,没错误能看到如下波形。