QCustomPlot的简单用法总结
写在前面,此处我只总结:VS2013+QT5.7.1下QCustomPlot库的使用方法。
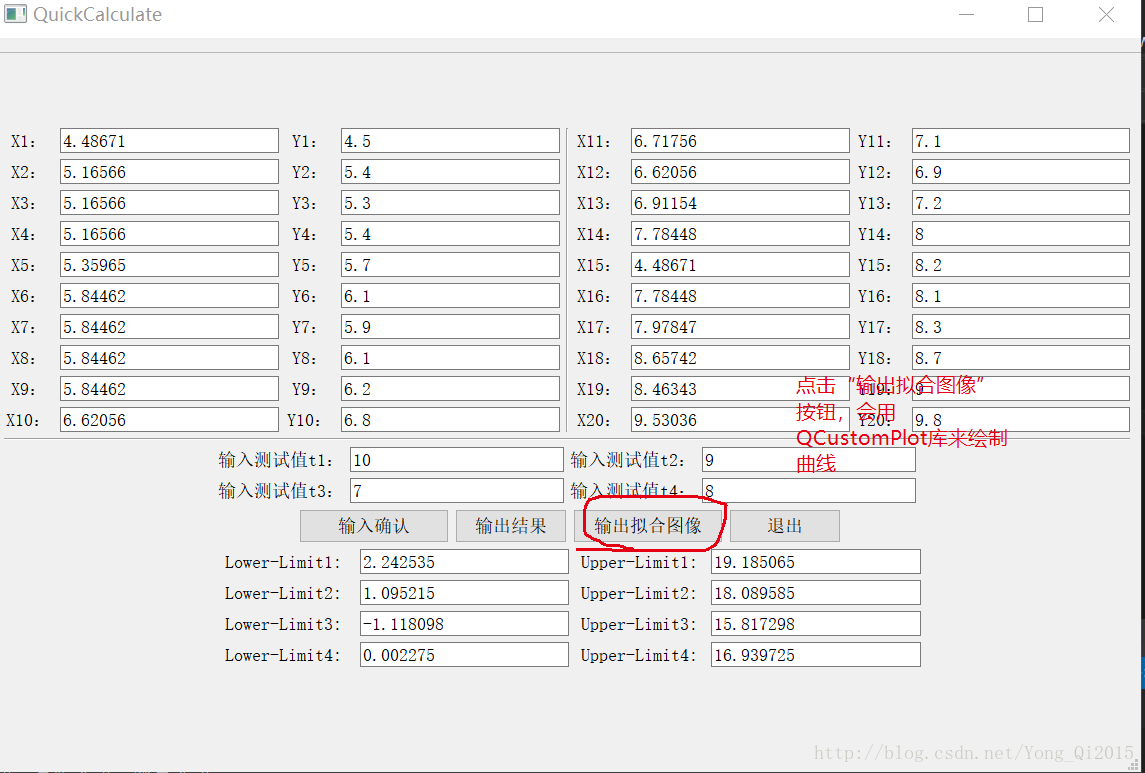
首先展示一下我利用QCustomPlot实现好的界面,如下截图所示:

第一部分:QCustomPlot的下载与安装
方法一:官网下载;
方法二:百度云网盘下载,传送门,(对应的是QCustomPlot2.0版本)。
第二部分:QCustomPlot在VS2013+QT下的使用
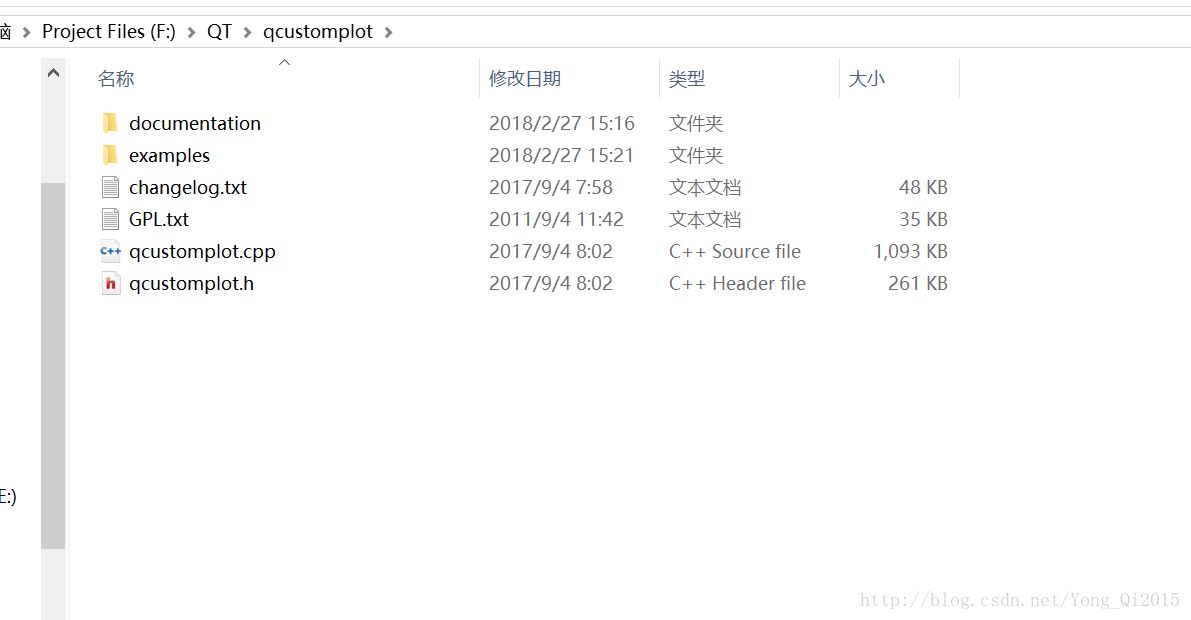
第一步:将上述下载好的安装包解压,如下图:
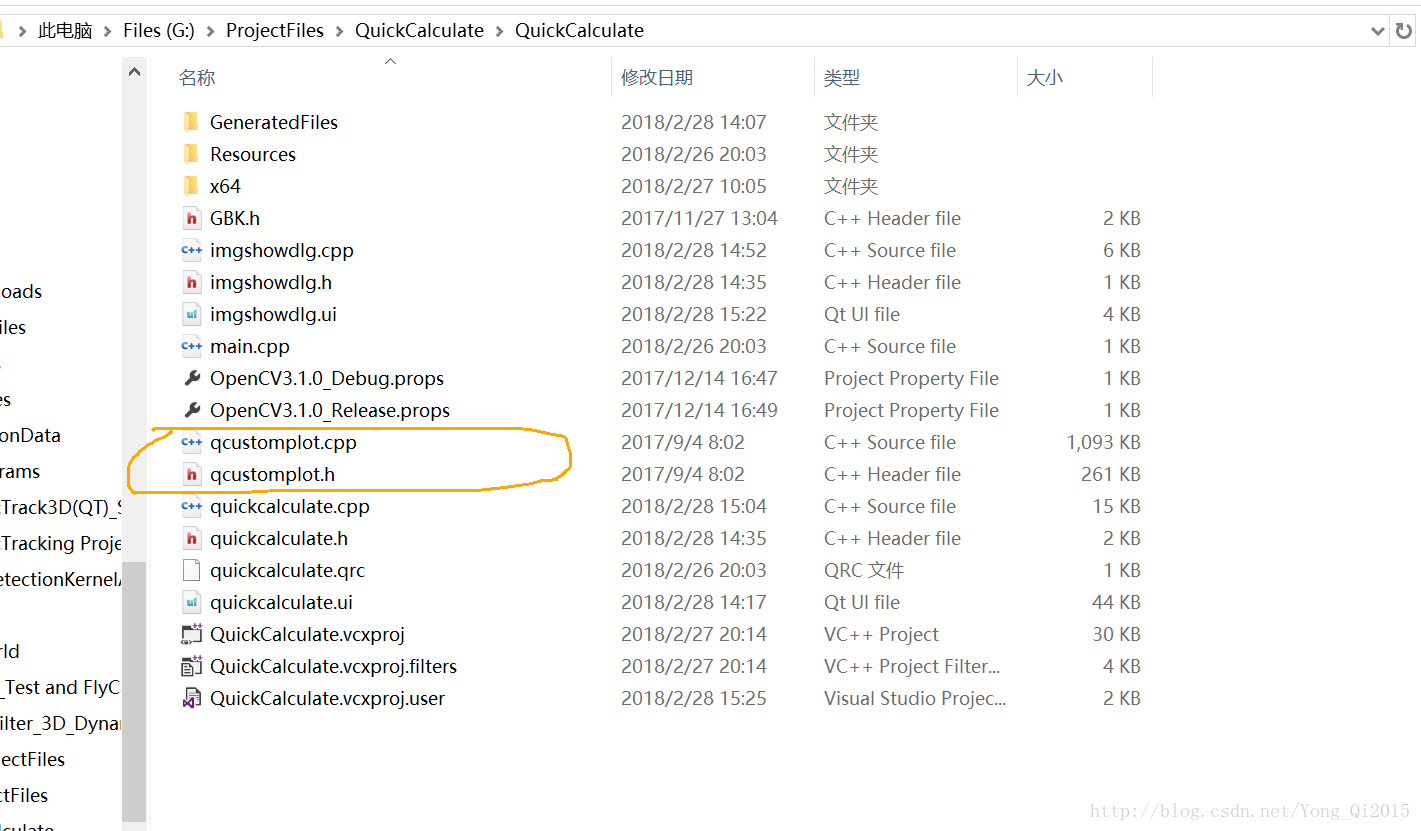
第二步:将上述文件夹下的”qcustomplot.cpp”以及”qcustomplot.h”文件拷贝到新建的QT目录下。如下图所示:
注意的地方(此处交待了项目属性的设置):
第一个注意点:
前置条件:建立 Qt5 Projects -> Qt Application工程,工程名假设为QPlot;
问题:编译出现“无法打开包括文件:“GLES2/gl2.h”: No such file or directory”;
解决办法:
“项目属性 -> 配置(C): 所有配置”
“项目属性 -> 配置属性 -> C/C++ -> 常规 -> 附加包含目录”里面添加“$(QTDIR)\include\QtANGLE”;第二个注意点:
向项目中添加QCustomPlot.h和QCustomPlot.cpp文件,然后通过 qtcreator打开qplot.ui文件,添加一个widgets,然后右键点击“提升为…”,提升的类名称:QCustomPlot,头文件:qcustomplot.h, objectName:customPlot;* 第三个注意点:*
前置条件:建立 Qt5 Projects -> Qt Application工程,工程名假设为QPlot;
问题:编译出现“找不到QtPrintSupport”;
解决办法:
“项目属性 -> 配置(C): 所有配置”
“项目属性 -> 配置属性 -> C/C++ -> 常规 -> 附加包含目录”里面添加“$(QTDIR)\include\QtPrintSupport”;
第三步:先按图中所示。
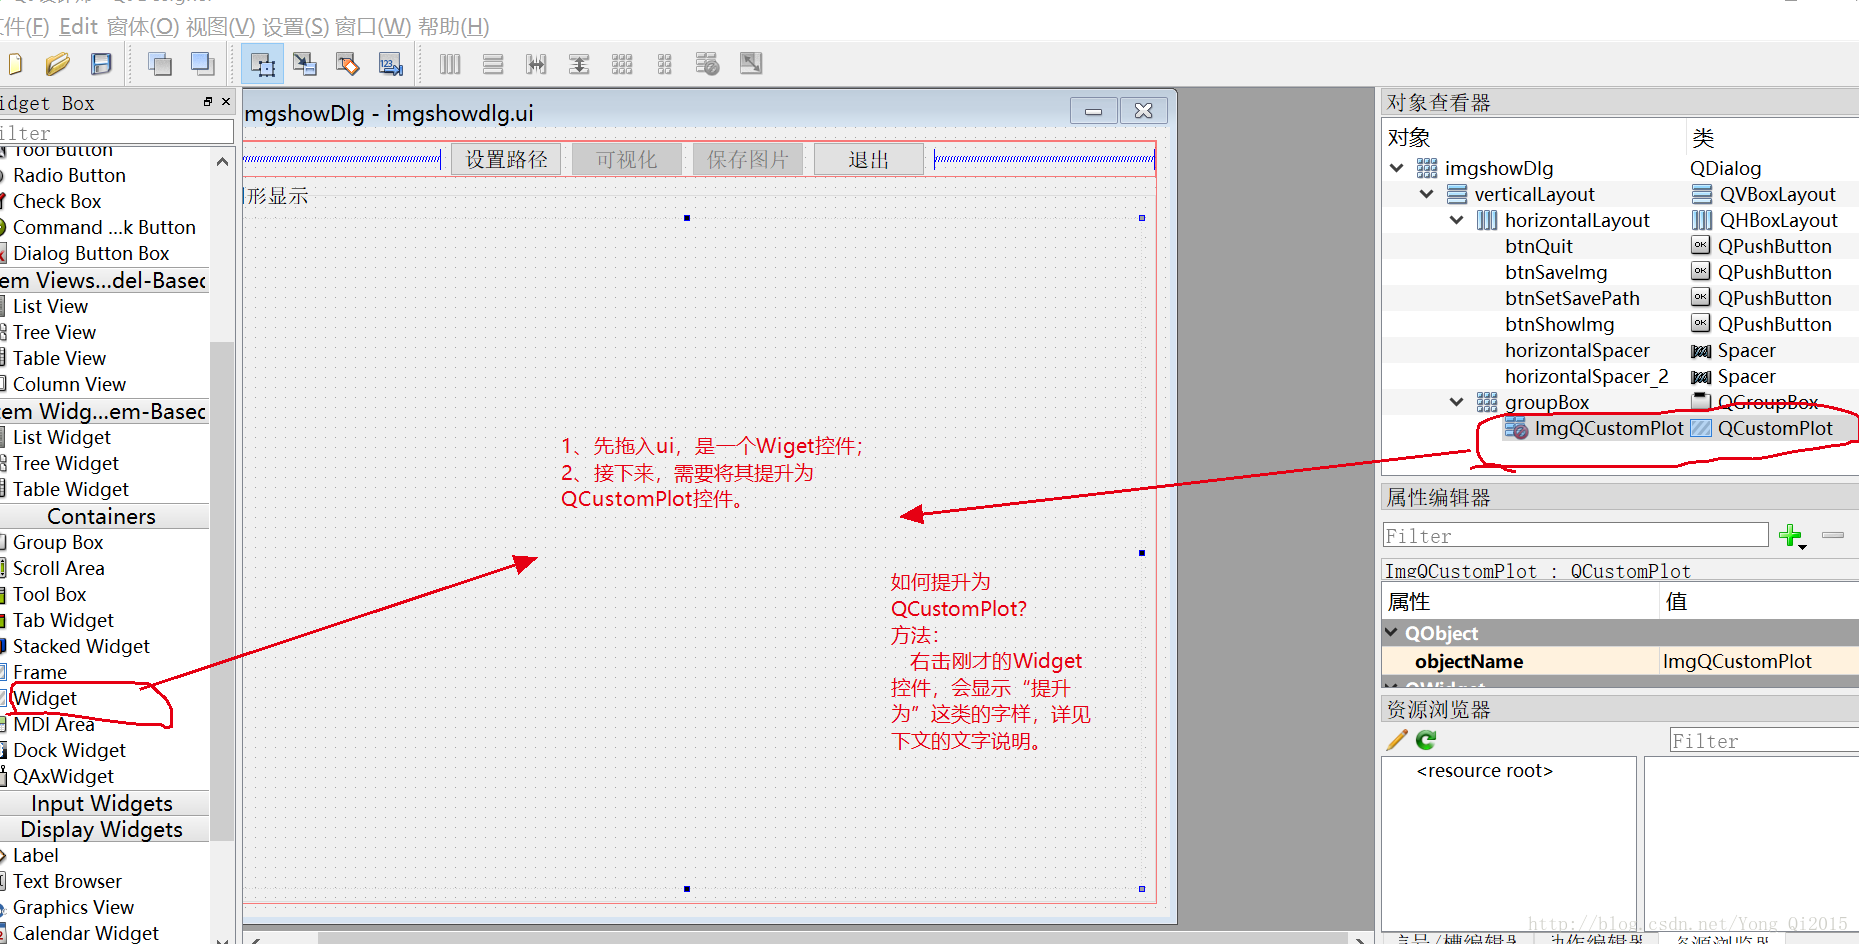
右击刚才的Widget控件,会得到如下窗口:
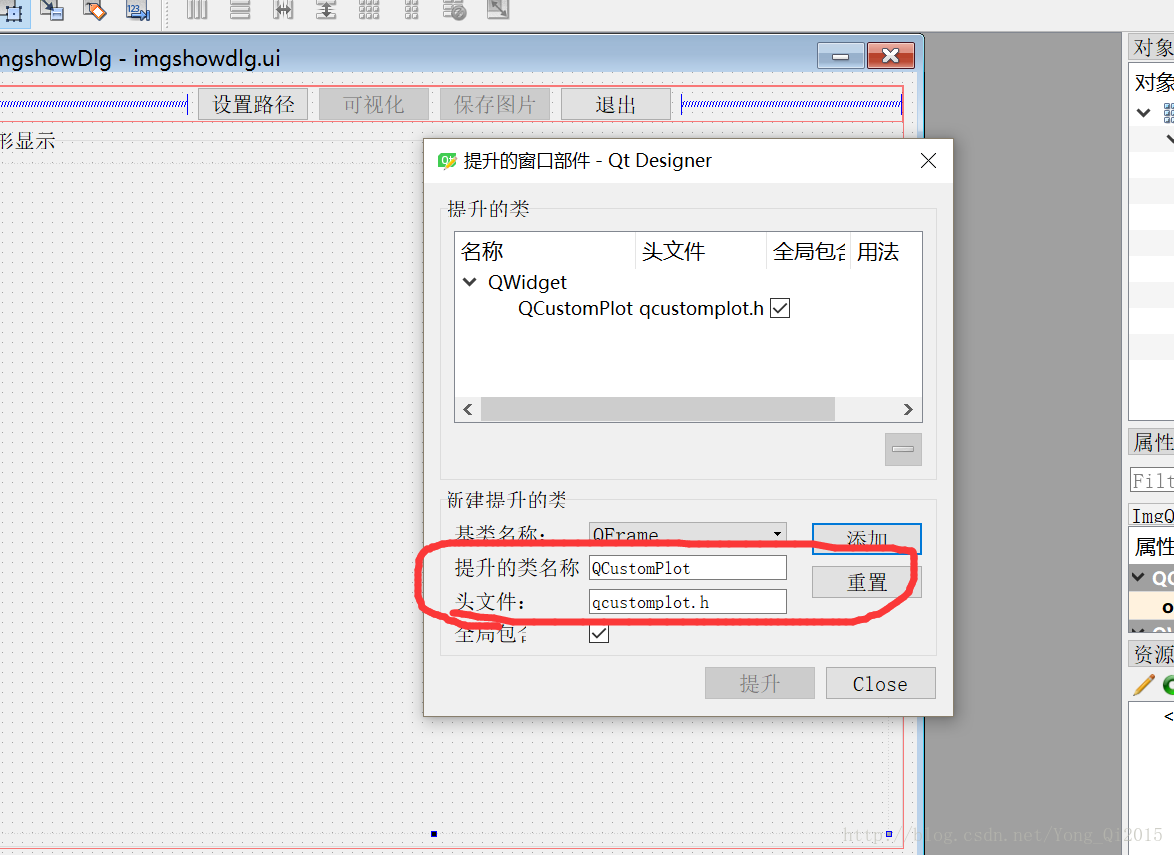
在提升的类名中输入:QCustomPlot即可,全局包含。
第四步:在进入该ui窗口的构造函数中输入如下代码:
 //之前的控件名对应着ImgQCustomPlot
 connect(ui.ImgQCustomPlot->xAxis, SIGNAL(rangeChanged(QCPRange)), ui.ImgQCustomPlot->xAxis2, SLOT(setRange(QCPRange)));
    connect(ui.ImgQCustomPlot->yAxis, SIGNAL(rangeChanged(QCPRange)),   ui.ImgQCustomPlot->yAxis2, SLOT(setRange(QCPRange)));
    ui.ImgQCustomPlot->xAxis2->setVisible(true);
    ui.ImgQCustomPlot->xAxis2->setTickLabels(false);
    ui.ImgQCustomPlot->yAxis2->setVisible(true);
    ui.ImgQCustomPlot->yAxis2->setTickLabels(false);
    ui.ImgQCustomPlot->xAxis->setLabel(GBK::ToUnicode("参考方法值"));
    ui.ImgQCustomPlot->yAxis->setLabel(GBK::ToUnicode("对比方法值"));
    ui.ImgQCustomPlot->setInteractions(QCP::iRangeDrag | QCP::iRangeZoom | QCP::iSelectPlottables);
    ui.ImgQCustomPlot->addGraph();
    //初始化
    //针对拟合直线进行初始化
    QPen pen(QColor("red"));
    ui.ImgQCustomPlot->graph()->setPen(pen); //设置点的颜色
    ui.ImgQCustomPlot->graph()->setLineStyle(QCPGraph::LineStyle::lsNone);
    ui.ImgQCustomPlot->graph()->setScatterStyle(QCPScatterStyle(QCPScatterStyle::ssDisc, 1)); //1:点的尺寸

    //针对上边界线
    ui.ImgQCustomPlot->addGraph();
    QPen penUpper(QColor("black"));
    ui.ImgQCustomPlot->graph(1)->setPen(penUpper); //设置点的颜色
    ui.ImgQCustomPlot->graph(1)->setLineStyle(QCPGraph::LineStyle::lsNone);
    ui.ImgQCustomPlot->graph(1)->setScatterStyle(QCPScatterStyle(QCPScatterStyle::ssDisc, 1)); //1:点的尺寸

    //针对下边界线
    ui.ImgQCustomPlot->addGraph();
    QPen penLower(QColor("black"));
    ui.ImgQCustomPlot->graph(2)->setPen(penLower); //设置点的颜色
    ui.ImgQCustomPlot->graph(2)->setLineStyle(QCPGraph::LineStyle::lsNone);
    ui.ImgQCustomPlot->graph(2)->setScatterStyle(QCPScatterStyle(QCPScatterStyle::ssDisc, 1)); //1:点的尺寸

    //针对20组数据点集
    ui.ImgQCustomPlot->addGraph();
    QPen penPnts(QColor("blue"));
    ui.ImgQCustomPlot->graph(3)->setPen(penPnts); //设置点的颜色
    ui.ImgQCustomPlot->graph(3)->setLineStyle(QCPGraph::LineStyle::lsNone);
    ui.ImgQCustomPlot->graph(3)->setScatterStyle(QCPScatterStyle(QCPScatterStyle::ssDisc, 3)); //1:点的尺寸

    ui.ImgQCustomPlot->yAxis->ticker()->setTickStepStrategy(ui.ImgQCustomPlot->xAxis->ticker()->tickStepStrategy());
    //ui.ImgQCustomPlot->setBackground(Qt::GlobalColor::black);
第五步:在该ui的显示图片按钮对应的响应函数中可以参考如下代码实现:
//显示数据点
void imgshowDlg::on_btnShowImg_clicked()
{
    //将20组数据拟合出一条直线
    //子窗口调用父窗口中的成员变量以及成员函数
    QuickCalculate *p = (QuickCalculate *)parentWidget();

    //将横坐标的值放到一个数值容器中
    std::vector<double> xVec;
    for (size_t i = 0; i < p->Point2dVec.size();i++)
    {
        xVec.push_back(p->Point2dVec[i].x);
    }
    //先找出横坐标的最大最小值
    std::vector<double>::iterator biggest = std::max_element(std::begin(xVec),std::end(xVec));
    double x_MaxValue = *biggest;
    auto smallest = std::min_element(std::begin(xVec), std::end(xVec));
    double x_MinValue = *smallest;

    ui.ImgQCustomPlot->graph(0)->data().clear();
    ui.ImgQCustomPlot->graph(1)->data().clear();
    ui.ImgQCustomPlot->graph(2)->data().clear();
    ui.ImgQCustomPlot->graph(3)->data().clear();
    QVector<double> x_value, y_value;

    int number = (int)(x_MaxValue - x_MinValue) / (0.01) + 1000;
    double x = x_MinValue - 5;
    double y = 0;
    for (int i = 0; i < number; i++)
    {
        x_value.push_back(x);
        y = p->k*(x - p->Pnt0.x) + p->Pnt0.y;
        y_value.push_back(y);
        x = x + 0.01;
    }
    //先绘制好拟合的直线 红色线
    //先绘制上边界
    ui.ImgQCustomPlot->graph(0)->setData(x_value,y_value);
    ui.ImgQCustomPlot->graph(0)->rescaleAxes();
    ui.ImgQCustomPlot->yAxis->setScaleRatio(ui.ImgQCustomPlot->xAxis, 1);

    //再添加两条边界线
    QVector<double> Upper_x_value, Upper_y_value;
    double Upper_X = x_MinValue - 5;
    double Upper_Y = 0;
    for (size_t j = 0; j < number;j++)
    {
        Upper_x_value.push_back(Upper_X);
        Upper_Y = p->k*(Upper_X - p->Pnt0.x) + p->Pnt0.y+p->R11_1;
        Upper_y_value.push_back(Upper_Y);
        Upper_X = Upper_X + 0.01;
    }

    ui.ImgQCustomPlot->graph(1)->setData(Upper_x_value, Upper_y_value);
    ui.ImgQCustomPlot->graph(1)->rescaleAxes();
    ui.ImgQCustomPlot->yAxis->setScaleRatio(ui.ImgQCustomPlot->xAxis, 1);

    //再绘制下边界
    QVector<double> Lower_x_value, Lower_y_value;
    double Lower_X = x_MinValue - 5;
    double Lower_Y = 0;
    for (size_t t = 0; t < number; t++)
    {
        Lower_x_value.push_back(Lower_X);
        Lower_Y = p->k*(Lower_X - p->Pnt0.x) + p->Pnt0.y-p->R11_1;
        Lower_y_value.push_back(Lower_Y);
        Lower_X = Lower_X + 0.01;
    }

    ui.ImgQCustomPlot->graph(2)->setData(Lower_x_value, Lower_y_value);
    ui.ImgQCustomPlot->graph(2)->rescaleAxes();
    ui.ImgQCustomPlot->yAxis->setScaleRatio(ui.ImgQCustomPlot->xAxis, 1);

    //绘制20组点数据
    QVector<double> xPnts, yPnts;
    for (size_t m = 0; m < p->Point2dVec.size();m++)
    {
        xPnts.push_back(p->Point2dVec[m].x);
        yPnts.push_back(p->Point2dVec[m].y);
    }

    ui.ImgQCustomPlot->graph(3)->setData(xPnts, yPnts);
    ui.ImgQCustomPlot->graph(3)->rescaleAxes();
    ui.ImgQCustomPlot->yAxis->setScaleRatio(ui.ImgQCustomPlot->xAxis, 1);

    ui.ImgQCustomPlot->replot();
    ui.btnSaveImg->setEnabled(true);

}
第六步:如果需要进行保存图片,如下代码可供参考:
//保存图片
void imgshowDlg::on_btnSaveImg_clicked()
{
    QString imgName="img.bmp";
    QString SavePath = imgPath + imgName;
    QByteArray byteA = SavePath.toLatin1();
    char *imgNameTem = byteA.data();
    ui.ImgQCustomPlot->saveBmp(imgNameTem);  //关键代码
}
总结,经过如上步骤,便可以利用QCustomPlot进行绘制多条曲线,显示点集,同时还可以进行对曲线图进行缩放显示。