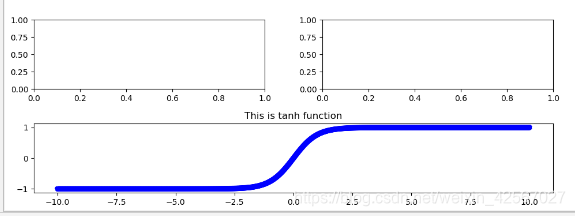
// An highlighted block
x = np.linspace(-10,10,1000)
y=np.tanh(x)
axScatter.scatter(x,y,linestyle='--',color='b')
#添加标签
axScatter.set_title('This is tanh function')
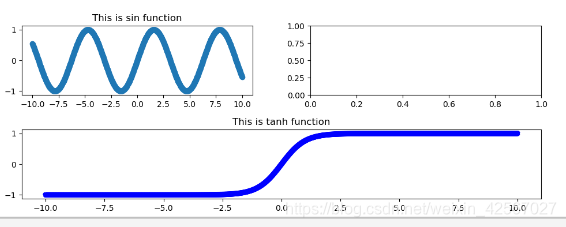
左上边的图
// An highlighted block
y1=np.sin(x)
axHisX.scatter(x,y1)
#添加标签
axHisX.set_title('This is sin function')
右上边的图
// An highlighted block
y3=np.cos(x)
axHisY.scatter(x,y3)
#添加标签
axHisY.set_title('This is cos function')
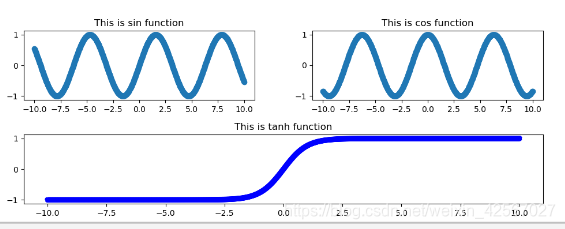
总程序
// An highlighted blockimport numpy as np
import matplotlib.pyplot as plt
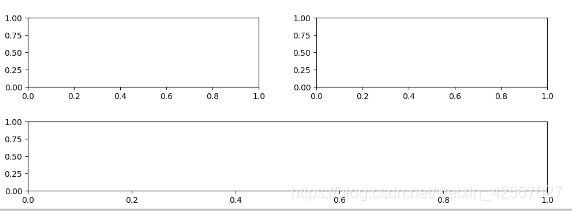
'''先画三个框'''
#plt.style.use('ggplot')
#根据图中的四个变量进行初始化
margin_border=0.05 #左边和底部到边界的距离
width=0.4 #上边两个长方形的图形的长
height=0.2 #上边两个长方形的图形的宽
margin_between=0.1 #三个图形之间的距离
'''设计三个图的尺寸和离边界的位置'''
#设计主图(最下边的图)
left_s=margin_border
bottom_s=margin_border
height_s=height
width_s=width+width+margin_between
#左上边的图
left_x=margin_border
bottom_x=margin_border+height+margin_between
height_x=height
width_x=width
#
#右上边的图
left_y=margin_border+width+margin_between
bottom_y=margin_border+height+margin_between
height_y=height
width_y=width
#整个图形的尺寸
plt.figure(1,figsize=(10,6)) #画布大小
rect_s=[left_s,bottom_s,width_s,height_s]
rect_x=[left_x,bottom_x,width_x,height_x]
rect_y=[left_y,bottom_y,width_y,height_y]
#生成图形
axScatter=plt.axes(rect_s)
axHisX=plt.axes(rect_x)
axHisY=plt.axes(rect_y)
#数据填充
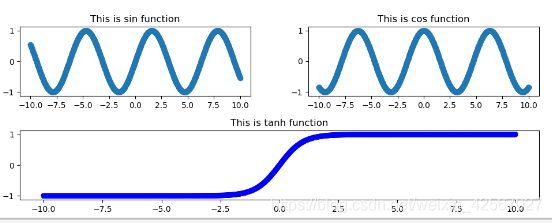
x = np.linspace(-10,10,1000)
y=np.tanh(x)
axScatter.scatter(x,y,linestyle='--',color='b')
axScatter.set_title('This is tanh function')
y1=np.sin(x)
axHisX.scatter(x,y1)
axHisX.set_title('This is sin function')
y3=np.cos(x)
axHisY.scatter(x,y3)
axHisY.set_title('This is cos function')
plt.show()