1、前言
这是《HaaS100开发调试系列》第5篇,建议读者把前面几篇快速浏览一下,可以帮助读者尽快上手AliOS Things的开发调试。
前几篇链接如下:
HaaS100开发调试系列 之 如何使用J-Link仿真器调试代码
HaaS100 开发调试系列 之 CPU利用率(cpuusage)的原理与使用
HaaS100开发调试系列 之 使用AliOS Things诊断调试组件定位Bug
本文主要分享开发调试过程中经常遇到的内存问题。
2、先抛出问题
在开发过程中,开发者总是会遇到诸如:
- 系统总内存怎么查询?
- 系统剩余可用内存还有多少呢,我的应用需要malloc 100KB空间,能成功吗?
- 查询到的系统可用内存还有200KB,为什么我连50KB都申请不到了呢?
- 系统跑着跑着,就会产生异常crash而死机了,查到原因是系统动态内存耗尽了,即出现了典型的内存泄漏,这个时候应该从哪着手查起呢?
上述的内存问题总是让人头痛,因此AliOS Things给开发者提供了一套强大的内存问题分析定位方法,即:
- 内存专用的CLI命令
- 内存查询API接口
- 内存dump机制
- 内存解析工具
结合这四种方法,希望尽可能给开发者提供系统内存分析,帮助开发者进一步定位内存问题。
3、打开相关组件
内存问题分析,依赖AliOS Things提供的debug组件和cli组件。打开步骤如下:
step1:在Config.in里select debug组件和CLI组件。
举例说明,当前使用的是helloworld_demo,那
进入 application/example/helloworld_demo/Config.in,增加2行代码
select AOS_COMP_DEBUG
select AOS_COMP_CLI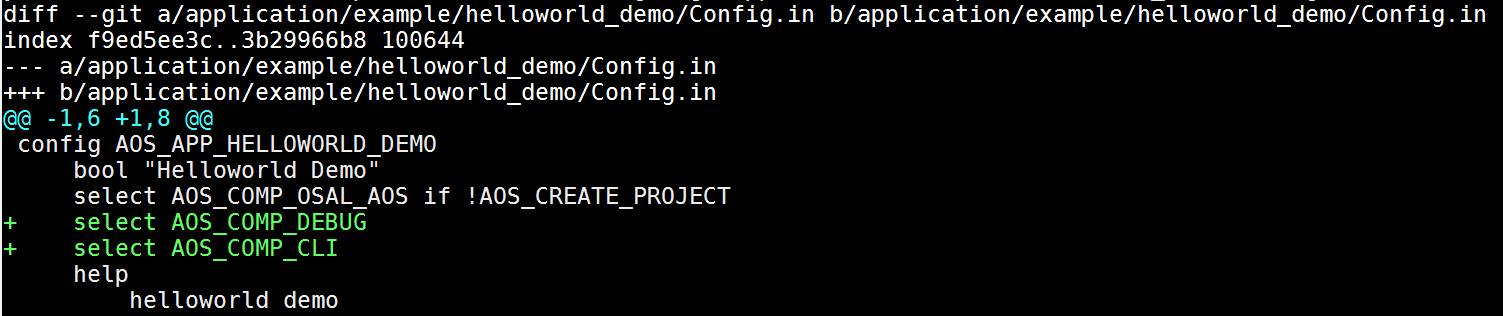
Step2:使能内存调试宏RHINO_CONFIG_MM_DEBUG,方法是在/platform/boarf/haas1000/config/k_config.h里打开
#ifndef RHINO_CONFIG_MM_DEBUG
#define RHINO_CONFIG_MM_DEBUG                1
#endifStep3: 重新编译上电
aos make distclean
aos make helloworld_demo@haas100 -c config
aos make
Step4 :烧录板子,参考 HaaS100快速开始
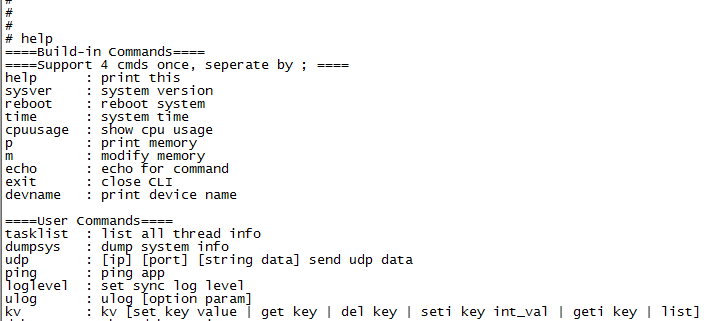
Step5:上电进入系统后,执行cli 命令,系统启动后,操作方法与其他的常用shell类似,按回车有#符号打印,输入help可查看系统自带的几个cli命令,表示系统已经支持cli 命令的输入。
4、内存CLI命令
4.1、内存状态查询
执行dumpsys mm 查看系统内存状态,会有下面的打印输出(举例):
dumpsys mm字段解释
HEAP中的内容含义(单位为字节):
• TotalSz:系统可供malloc的动态内存总大小;
• FreeSz:系统当前空闲内存大小;
• UsedSz:系统当前已经分配的内存大小,即UsedSz = TotalSz – FreeSz;
• MinFreeSz:系统空闲内存的历史最小值,即TotalSz – MinFreeSz 便是内存历史使用量峰值;
• MaxFreeBlkSz:系统最大空闲块Size,表示系统此时可供分配出来的内存最大值。
上面各字段就可以回答本文开头的一些问题:
“系统总内存怎么查询”—— TotalSz
“系统剩余可用内存”—— FreeSz
“查询到的系统可用内存还有200KB,为什么我连50KB都申请不到了呢?” —— 查看MaxFreeBlkSz,这个字段表示系统此时可供分配出来的内存最大值。如果系统大量存在非常小段内存的不断malloc和free的情况,系统会产生一些内存碎片,这个时候即使系统可用内存(FreeSz)还够,也只能最大分配出MaxFreeBlkSz的内存。关于AliOS Things使用的内存算法和对内存碎片的处理,请读者关注我们后续的文章。
4.2、内存log dump
执行dumpsys mm_info 可将系统的详细动态内存信息dump出来,如果系统有很多的内存malloc,这一步可能会dump的时间比较久,示例如下:
dumpsys mm_info------------------------------- all memory blocks ---------------------------------
g_kmm_head = 34002240
ALL BLOCKS
address, stat size dye caller pre-stat point
0x34002318 used 8 fefefefe 0x0 pre-used;
0x34002330 used 32 fefefefe 0x229ad7 pre-used;
0x34002360 used 32 fefefefe 0x22b5cf pre-used;
0x34002390 used 40 fefefefe 0x22d14f pre-used;
0x340023c8 used 32 fefefefe 0x208e03 pre-used;
0x340023f8 used 40 fefefefe 0x22c3af pre-used;
0x34002430 used 40 fefefefe 0x22c3af pre-used;
0x34002468 used 40 fefefefe 0x22d14f pre-used;
0x340024a0 used 32 fefefefe 0x229ad7 pre-used;
0x340024d0 used 32 fefefefe 0x22b5cf pre-used;
0x34002500 used 80 fefefefe 0x207b67 pre-used;
0x34002560 used 32 fefefefe 0x229ad7 pre-used;
0x34002590 used 32 fefefefe 0x22b5cf pre-used;
0x340025c0 used 40 fefefefe 0x22d14f pre-used;
0x340025f8 used 32 fefefefe 0x229ad7 pre-used;
0x34002628 used 32 fefefefe 0x22b5cf pre-used;
0x34002658 used 131072 fefefefe 0x22d865 pre-used;
0x34022668 used 200 fefefefe 0x22d86f pre-used;
0x34022740 used 2048 fefefefe 0x1c5d8979 pre-used;
0x34022f50 used 40 fefefefe 0x1c5ddc59 pre-used;
0x34022f88 used 800 fefefefe 0x1c5d671b pre-used;
0x340232b8 used 8192 fefefefe 0x22d865 pre-used;
0x340252c8 used 200 fefefefe 0x22d86f pre-used;
0x340253a0 used 32 fefefefe 0x1c5d9055 pre-used;
0x340253d0 used 40 fefefefe 0x1c5d5cf9 pre-used;
0x34025408 used 5120 fefefefe 0x1c5dd8fd pre-used;
0x34026818 used 80 fefefefe 0x1c5d5da7 pre-used;
0x34026878 used 3072 fefefefe 0x22d865 pre-used;
0x34027488 used 200 fefefefe 0x22d86f pre-used;
0x34027560 used 40 fefefefe 0x1c5d7901 pre-used;
0x34027598 used 40 fefefefe 0x1c5d7935 pre-used;
0x340275d0 used 40 fefefefe 0x22c3af pre-used;
0x34027608 used 32 fefefefe 0x1c5dde4f pre-used;
0x34027638 used 32 fefefefe 0x1c5d90e7 pre-used;
0x34027668 used 40 fefefefe 0x1c5d8e03 pre-used;
0x340276a0 used 40 fefefefe 0x1c5d5cf9 pre-used;
0x340276d8 used 32 fefefefe 0x1c5d9161 pre-used;
0x34027708 used 32 fefefefe 0x1c5d916b pre-used;
0x34027738 used 432 fefefefe 0x2078a7 pre-used;
0x340278f8 used 1024 fefefefe 0x207dc7 pre-used;
0x34027d08 used 512 fefefefe 0x1c5d6251 pre-used;
0x34027f18 free 6660872 abababab 0x0 pre-used; free[(nil) ,(nil) ]
0x34682230 used sentinel fefefefe 0x0 pre-free [0x34027f18];
----------------------------- all free memory blocks -------------------------------
freelist bitmap: 0x20000
address, stat size dye caller pre-stat point
0x34027f18 free 6660872 abababab 0x0 pre-used; free[(nil) ,(nil) ]
------------------------- memory allocation statistic ------------------------------
---------------------------------------------------------------------------
[HEAP]| TotalSz | FreeSz | UsedSz | MinFreeSz | MaxFreeBlkSz |
| 0x00680000 | 0x0065A308 | 0x00025CF8 | 0x0065A0F8 | 0x0065A308 |
---------------------------------------------------------------------------
-----------------number of alloc times:-----------------
[2^06] bytes: 33 |[2^07] bytes: 1 |[2^08] bytes: 3 |[2^09] bytes: 1 |
[2^10] bytes: 987 |[2^11] bytes: 1 |[2^12] bytes: 2 |[2^13] bytes: 1 |
[2^14] bytes: 1 |[2^15] bytes: 0 |[2^16] bytes: 0 |[2^17] bytes: 0 |
[2^18] bytes: 1 |[2^19] bytes: 0 |[2^20] bytes: 0 |[2^21] bytes: 0 |
[2^22] bytes: 0 |[2^23] bytes: 0 |[2^24] bytes: 0 |[2^25] bytes: 0 |
[2^26] bytes: 0 |[2^27] bytes: 0 |[2^28] bytes: 0 |[2^29] bytes: 0 |
字段解释
重点关注的是“ all memory blocks”下面的log,其中几个关键的字段含义为:
• address:用户malloc后,系统分配出来的地址,即malloc的返回值
• stat: 内存状态,used表示malloc后内存还在使用,free表示这块内存已经释放
• size:malloc的大小(单位:字节)
• caller:调用malloc的地方,即这块内存的使用者是谁。
• dye/pre-stat:AliOS Things使用的内存管理算法相关,这里不赘述。
5、查看内存的API接口
如果需要在代码中调用内存状态查询,AliOS Things也提供了如下API接口,该接口的输出与上述执行dumpsys mm的输出一致。
//需要包含的头文件
#include "aos/debug.h"

//接口调用方法
aos_debug_mm_overview(NULL)
6、内存log解析工具的使用
面对上面dumpsys mm_info命令输出的这么多log,我们怎么分析呢?
配合使用coredump_parser.py(路径在/components/utility/debug_tools/)解析为:
========== Show MM Statistic Info  ==========
--------------------------------------------------------------------------------------------------------------------------------------------------------------
 Alloc Addr  |           Func           | Cnt  |  Total Size  |   Line   |       File
--------------------------------------------------------------------------------------------------------------------------------------------------------------
  0x208e03   |          srand           |  1   |      32      |          |     reent.c
 0x1c5d9055  | aos_register_event_filter |  1   |      32      |   131    | /workspace/hass/AliOS-Things/components/utility/yloop/src/local_event.c
 0x1c5dde4f  |    vfs_inode_set_name    |  1   |      32      |    25    | /workspace/hass/AliOS-Things/core/vfs/vfs_inode.c
 0x1c5d90e7  |      aos_loop_init       |  1   |      32      |    85    | /workspace/hass/AliOS-Things/components/utility/yloop/src/yloop.c
 0x1c5d9161  |     aos_poll_read_fd     |  1   |      32      |   113    | /workspace/hass/AliOS-Things/components/utility/yloop/src/yloop.c
 0x1c5d916b  |     aos_poll_read_fd     |  1   |      32      |   114    | /workspace/hass/AliOS-Things/components/utility/yloop/src/yloop.c
 0x1c5ddc59  |     vfs_lock_create      |  1   |      40      |    17    | /workspace/hass/AliOS-Things/core/vfs/vfs_adapt.c
 0x1c5d7901  |      kv_lock_create      |  1   |      40      |    33    | /workspace/hass/AliOS-Things/core/kv/kv_adapt.c
 0x1c5d7935  |      kv_sem_create       |  1   |      40      |    82    | /workspace/hass/AliOS-Things/core/kv/kv_adapt.c
 0x1c5d8e03  |        event_open        |  1   |      40      |    40    | /workspace/hass/AliOS-Things/components/utility/yloop/src/device.c
  0x207b67   |        localtime         |  1   |      80      |          |     reent.c
 0x1c5d5cf9  |      aos_mutex_new       |  2   |      80      |   147    | /workspace/hass/AliOS-Things/core/osal/aos/rhino.c
 0x1c5d5da7  |      aos_queue_new       |  1   |      80      |   349    | /workspace/hass/AliOS-Things/core/osal/aos/rhino.c
  0x22d14f   |  krhino_sem_dyn_create   |  3   |     120      |   102    | /workspace/hass/AliOS-Things/core/rhino/k_sem.c
  0x22c3af   | krhino_mutex_dyn_create  |  3   |     120      |   125    | /workspace/hass/AliOS-Things/core/rhino/k_mutex.c
  0x229ad7   |      osThreadCreate      |  4   |     128      |   250    | /home/william.wgj/work/code/shenmu_lite/shenmu_github/shenmu_aos/platform/mcu/haas1000
                                                                           /drivers/out/haas1000_normalization/../../rtos/rhino/cmsis/cmsis_os.c
  0x22b5cf   | krhino_event_dyn_create  |  4   |     128      |   102    | /workspace/hass/AliOS-Things/core/rhino/k_event.c
  0x2078a7   |       __sfmoreglue       |  1   |     432      |          |     reent.c
 0x1c5d6251  |       proc_onecmd        |  1   |     512      |   156    | /workspace/hass/AliOS-Things/core/cli/cli.c
  0x22d86f   |     task_dyn_create      |  3   |     600      |   280    | /workspace/hass/AliOS-Things/core/rhino/k_task.c
 0x1c5d671b  |         cli_init         |  1   |     800      |   697    | /workspace/hass/AliOS-Things/core/cli/cli.c
  0x207dc7   |       __smakebuf_r       |  1   |     1024     |          |     reent.c
 0x1c5d8979  |      hal_uart_init       |  1   |     2048     |   333    | /workspace/hass/AliOS-Things/platform/mcu/haas1000/hal/uart.c
 0x1c5dd8fd  |     uring_fifo_init      |  1   |     5120     |    25    | /workspace/hass/AliOS-Things/components/dm/ulog/ulog_ring_fifo.c
  0x22d865   |     task_dyn_create      |  3   |    142336    |   275    | /workspace/hass/AliOS-Things/core/rhino/k_task.c
--------------------------------------------------------------------------------------------------------------------------------------------------------------
6.1、使用方法
- 将串口输出的异常log 拷贝至coredump_parser.py的同级目录中,文件名任意,这里取名为log
- 将elf文件也拷贝至coredump_parser.py的同级目录,elf 路径为out/helloworld_demo@haas100/binary/[email protected]
- 执行下面命令(举例)
python coredump_parser.py log [email protected]如果系统提示如“arm-none-eabi-gcc”找不到,表示使用的工具链没有在系统PATH下,
根据提示,可以在命令后加上-p 指定工具链路径(推荐),如:
python coredump_parser.py log.txt [email protected] -p /workspace/hass/AliOS-Things/build/compiler/gcc-arm-none-eabi/Linux64/bin/这个工具会将系统内存malloc情况输出到表格中,并且按照Total Size从小到大排序,同时指出了每个内存块的申请者caller在代码中的位置,一目了然。如果开发者定位或者怀疑此时系统内出现了内存泄漏,那么经过上面的解析出的系统内存使用,可以直接看出哪个模块的内存只有申请没有释放了,一般是Total Size 最大的那个点!
7、小结
系统内存问题的定位比较复杂,使用上面几个方法,可以有效的帮助开发者定位排查一些内存问题,希望开发者多多尝试上面的命令,灵活使用,才能发挥出AliOS Things的诊断调试的强大功能。
如需更多技术支持,可加入钉钉开发者群

更多技术与解决方案介绍,请访问阿里云AIoT首页https://iot.aliyun.com/