简介
要想给用户好的体验,性能优化是必不可少的,但是要进行性能优化要先进行性能检测,只有查出了问题,才能“对症下药”。
本篇主要讲解如何通过代码对 CPU 进行性能检测,讲解简单用法及部分原理。
原理(Android 8.0 以下)
获取整机CPU使用情况
要查看机器的CPU使用情况,可通过查看/proc/stat 文件,该文件包含了所有自系统启动以来累计的CPU活动信息。
查看方式:
- 在 adb shell模式下,输入cat /proc/stat
- 在 root 手机上查看 /proc/stat 文件内容
以我的手机为例,打开文件后,可以看到如下内容:
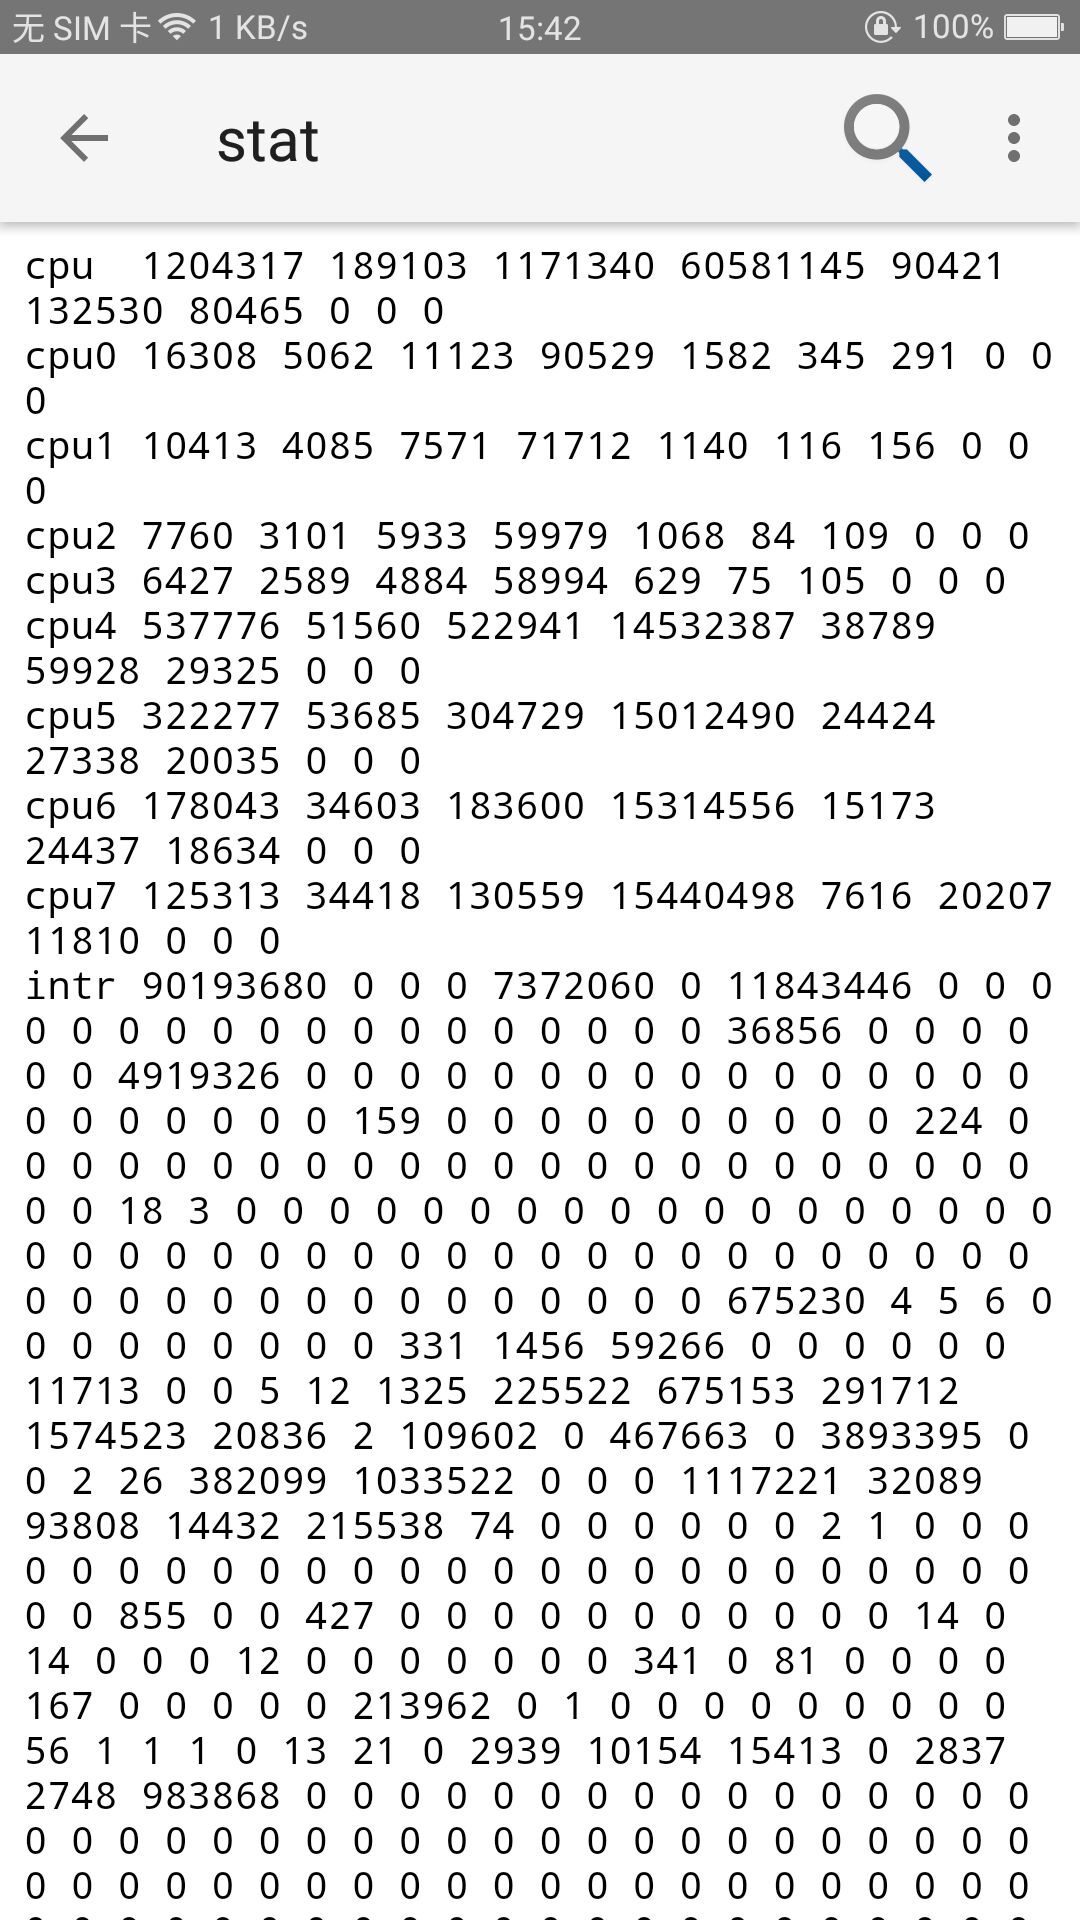
第一行表示的是CPU总的使用情况。
以上数据的单位是jiffies, jiffies是内核中的一个全局变量,用来记录自系统启动一来产生的节拍数,在linux中,一个节拍大致可理解为操作系统进程调度的最小时间片,不同linux内核可能值有不同,通常在1ms到10ms之间。
上图所示的第一行数据即为设备所有cpu的运行数据,其含义如下:
- user (1204317):从系统启动开始累计到当前时刻,处于用户态的运行时间,不包含 nice值为负进程。
- nice (189103):从系统启动开始累计到当前时刻,nice值为负的进程所占用的CPU时间。这里解释下何为 nice。
- 每一个进程都有一个 PRI 和 NI 值,可通过 ps -l 命令查看。PRI 还是比较好理解的,即进程的优先级,或者通俗点说就是程序被 CPU 执行的先后顺序,此值越小进程的优先级别越高。那 NI 呢?就是我们所要说的 nice 值了,其表示进程可被执行的优先级的修正数值。如前面所说,PRI值越小越快被执行,那么加入 nice 值后,将会使得 PRI 变为:PRI(new)=PRI(old)+nice。这样,当nice值为负值的时候,那么该程序将会优先级值将变小,即其优先级会变高,则其越快被执行。
- system (1171340):从系统启动开始累计到当前时刻,处于核心态的运行时间。
- idle (60581145):从系统启动开始累计到当前时刻,除 IO 等待时间以外的其它等待时间。
- iowait (90421):从系统启动开始累计到当前时刻,IO等待时间。
- irq (132530):从系统启动开始累计到当前时刻,硬中断时间。
- softirq (80465):从系统启动开始累计到当前时刻,软中断时间。
- stealstolen (0):在虚拟机环境下运行其他操作系统所花费的时间。
- guest (0):运行在访客模式下所花费的时间。
- guest_nice (0):运行在访客模式下,nice值为负的进程所占用的CPU时间。
计算总的cpu时间
- 采样两个足够短的时间间隔的 cpu 快照,分别为 t1,t2,其中 t1、t2 均包含(user、nice、system、idle、iowait、irq、softirq、stealstolen、 guest)9个元素;
- 计算总的 cpu 时间
- 把第一次的所有 cpu 使用情况求和,得到 total_t1;
- 把第二次的所有 cpu 使用情况求和,得到 total_t2;
- 这个时间间隔内的所有时间片,即 totalCpuTime = total_t2 - total_t1 ;
- 计算空闲时间 idle
- idle 对应第四列的数据,用第二次的 idle - 第一次的 idle 即可
- idle = idle_t2 – idle_t1
- 计算cpu使用率
cpuUsage = 100 * (total_t2 - total_t1 – (idle_t2 – idle_t1)) / (total_t2 – total_t1)
获取应用相关的CPU使用情况
- 通过 ps -l 命令查看应用的 pid;
- 输入命令:cat /proc//stat,可查看应用相关的CPU使用情况或直接去指定文件查看

- pid(24931):进程号
- S:表示任务状态为Sleep
- utime (106):该任务在用户态运行的时间,单位为jiffies
- stime(28):该任务在核心态运行的时间,单位为jiffies
应用相关的CPU使用率计算方法
- 同样采样两个足够短的时间间隔的CPU快照,t1,t2
- 计算总的CPU时间和应用所占的CPU时间。总的CPU时间上面已经介绍过了。
- 应用进程所占用的CPU时间 pcpu=utime + stime,
- 再除以总的cpu时间,即可得到该进程的cpu占用率了。
- pcpuUsage=100*(pcpu_t2 - pcpu_t1)/(total_t2 - total_t1)
代码实现
有了以上的理论基础,剩下的就是用代码来实现读取和计算的工作了。下面附一段简单的示例:
var mProcStatFile: RandomAccessFile = RandomAccessFile("/proc/stat", "r")
var mAppStatFile: RandomAccessFile = RandomAccessFile("/proc/" + android.os.Process.myPid() + "/stat", "r")
var mLastCpuTime: Long? = null
var mLastAppCpuTime: Long? = null

/**
 * 8.0以下获取cpu的方式
 *
 * @return
 */
val cpuData: Float
    get() {


        val cpuTime: Long
        val appTime: Long
        var value = 0.0f
        try {


            mProcStatFile.seek(0L)
            mAppStatFile.seek(0L)
            val procStatString = mProcStatFile.readLine()
            val appStatString = mAppStatFile.readLine()
            val procStats = procStatString.split(" ".toRegex()).toTypedArray()
            val appStats = appStatString.split(" ".toRegex()).toTypedArray()
            for ((index, item) in procStats.withIndex()) {


                println("procStats + $index:$item")
            }
            for ((index, item) in appStats.withIndex()) {


                println("appStats + $index:$item")
            }
            cpuTime = procStats[2].toLong()
            + procStats[3].toLong()
            + procStats[4].toLong()
            + procStats[5].toLong()
            + procStats[6].toLong()
            + procStats[7].toLong()
            + procStats[8].toLong()
            appTime = appStats[13].toLong() + appStats[14].toLong()
            if (mLastCpuTime == null && mLastAppCpuTime == null) {


                mLastCpuTime = cpuTime
                mLastAppCpuTime = appTime
                return value
            }
            value = (appTime - mLastAppCpuTime!!).toFloat() / (cpuTime - mLastCpuTime!!).toFloat() * 100f
            mLastCpuTime = cpuTime
            mLastAppCpuTime = appTime
        } catch (e: Exception) {


            e.printStackTrace()
        }
        return value
    }
原理(Android 8.0 及以上)
由于 Android 8.0 以后 Google 的权限限制,SDK 再也拿不到进程 CPU 的实时占用率,只能拿到自己本身进程的 Jiffies,而由于拿不到系统整体 Jiffies 的情况下,就没办法衡量 CPU 当前的消耗状况了,也没办法根据当前 CPU 状态实时做一些策略调整。因此进行深入研究以后,给出 Android 8.0 以后判断CPU状态的方案(非标准答案)- 执行 TOP 获取 CPU 占比。
原理简析
从 TOP 命令的源码中可以看出,TOP 本身也是拿到 /proc/stat 后统计的。
PS:有兴趣的,可以去翻一波源码。
通过 TOP 命令获取到的相关信息如下:
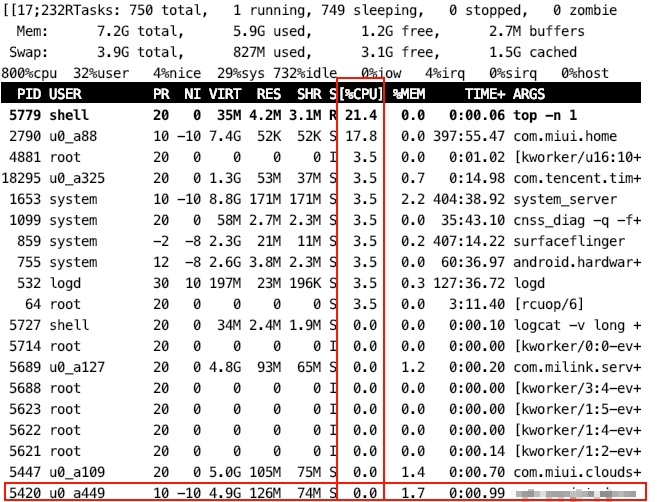
从上图中,可以明显看出 %CPU,只要除以对应的 CPU 数,即可获取 CPU 占用率。
代码实现
/**
 * 8.0以上获取cpu的方式
 *
 * @return
 */
val cpuDataForO: Float
    get() {


        var process: Process? = null
        try {


            process = Runtime.getRuntime().exec("top -n 1")
            val reader = BufferedReader(InputStreamReader(process.inputStream))
            var line: String
            var cpuIndex = -1
            while (reader.readLine().also {

     line = it } != null) {


                line = line.trim {

     it <= ' ' }
                if (TextUtils.isEmpty(line)) {


                    continue
                }
                val tempIndex = getCPUIndex(line)
                if (tempIndex != -1) {


                    cpuIndex = tempIndex
                    continue
                }
                if (line.startsWith(android.os.Process.myPid().toString())) {


                    if (cpuIndex == -1) {


                        continue
                    }
                    val param = line.split("\\s+".toRegex()).toTypedArray()

                    for ((index,item) in param.withIndex()){


                        println("index $index : $item")
                    }
                    if (param.size <= cpuIndex) {


                        continue
                    }
                    var cpu = param[cpuIndex]
                    if (cpu.endsWith("%")) {


                        cpu = cpu.substring(0, cpu.lastIndexOf("%"))
                    }
                    return cpu.toFloat() / Runtime.getRuntime().availableProcessors()
                }
            }
        } catch (e: IOException) {


            e.printStackTrace()
        } finally {


            process?.destroy()
        }
        return 0F
    }

fun getCPUIndex(line: String): Int {


    if (line.contains("CPU")) {


        val titles = line.split("\\s+".toRegex()).toTypedArray()
        for (i in titles.indices) {


            if (titles[i].contains("CPU")) {


                return i
            }
        }
    }
    return -1
}
上文若存在问题,欢迎指出!