"""
==================
Colormap reference
==================
Reference for colormaps included with Matplotlib.
This reference example shows all colormaps included with Matplotlib. Note that
any colormap listed here can be reversed by appending "_r" (e.g., "pink_r").
These colormaps are divided into the following categories:
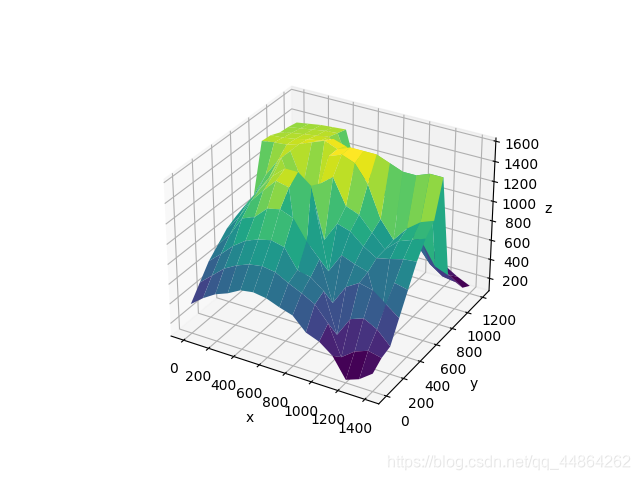
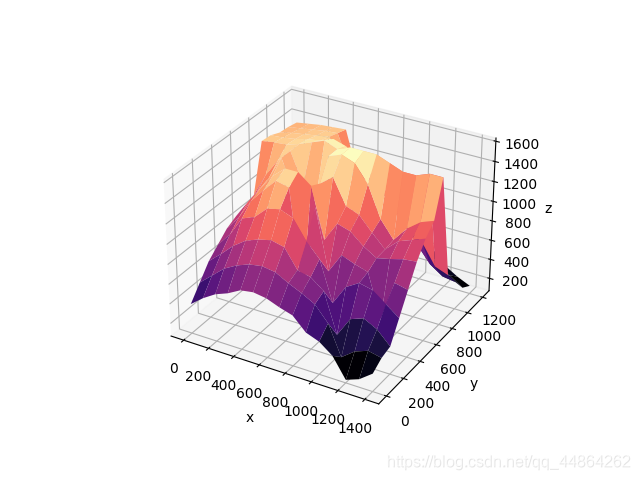
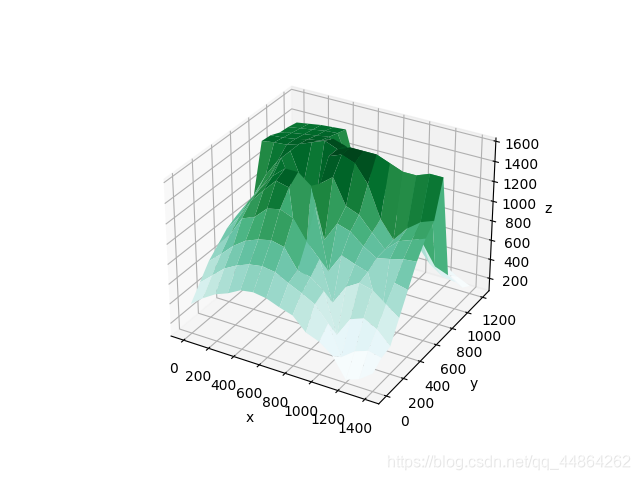
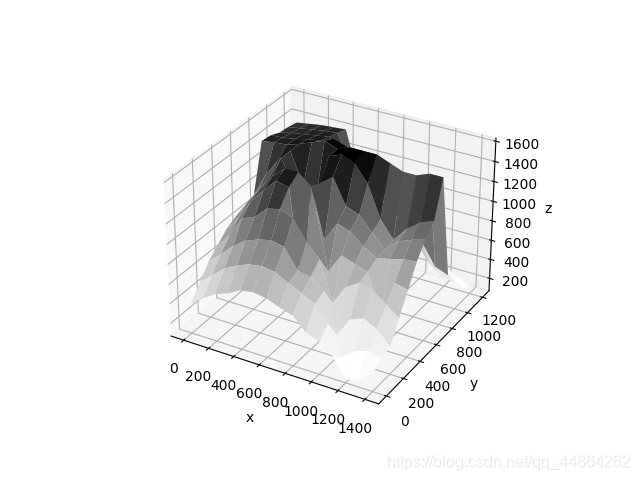
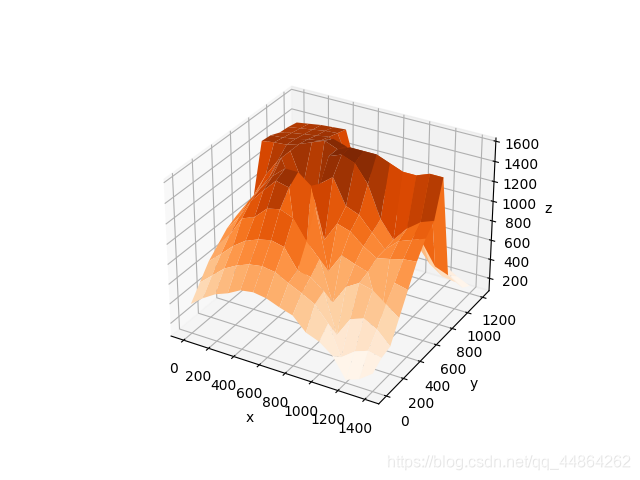
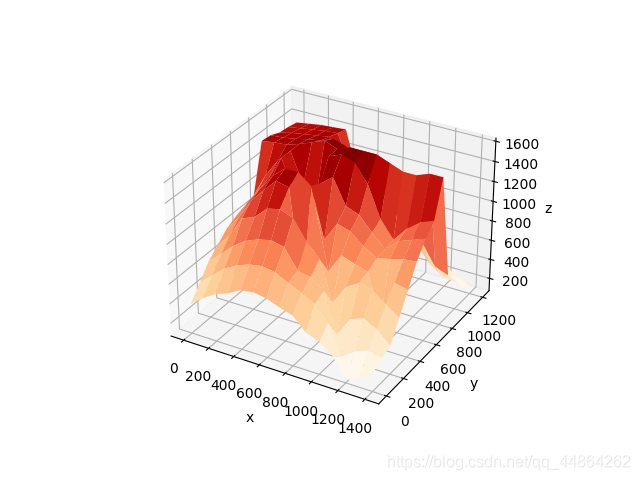
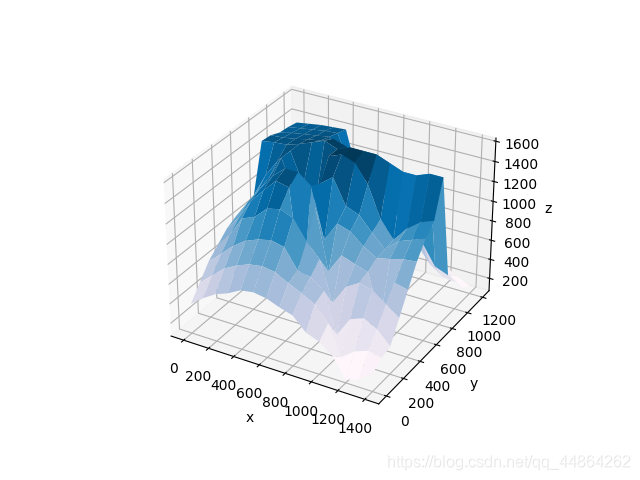
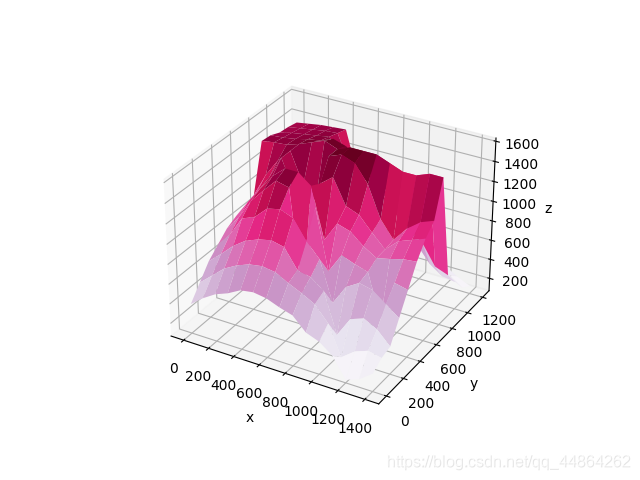
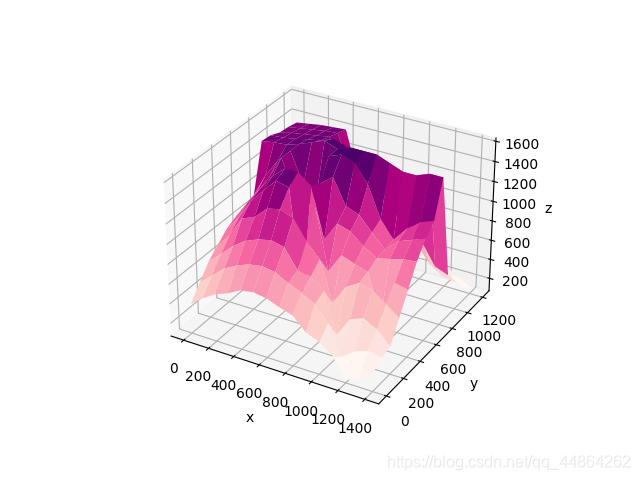
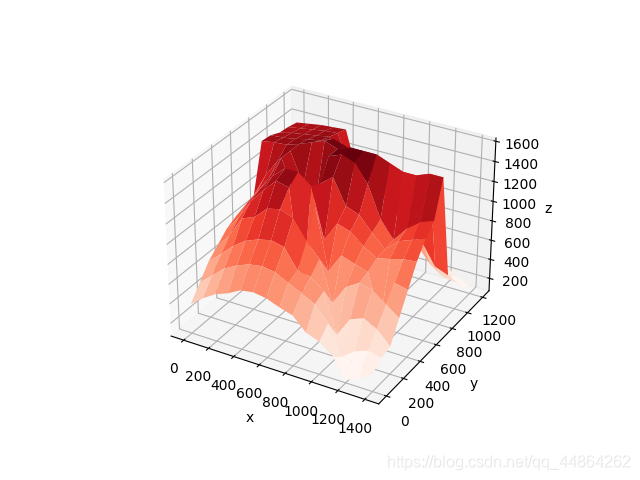
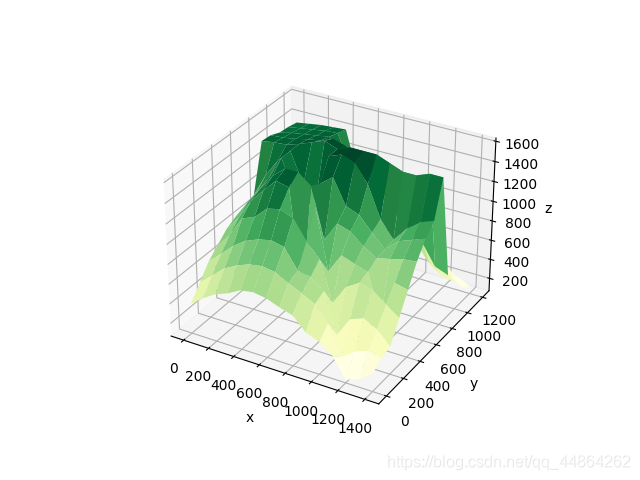
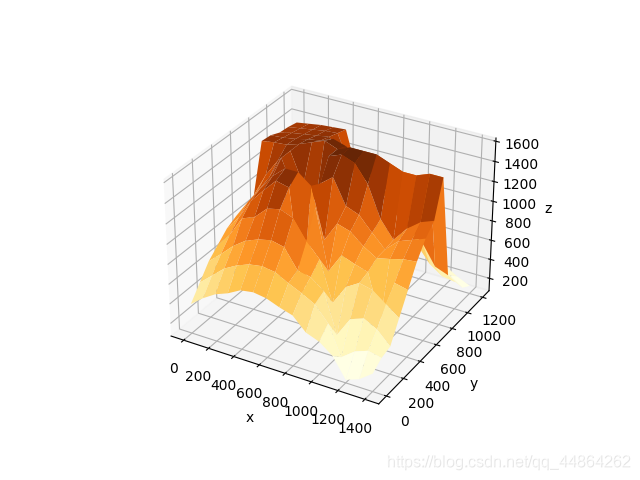
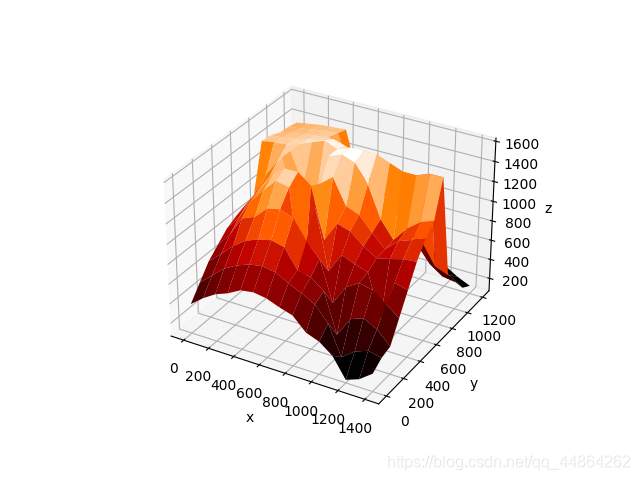
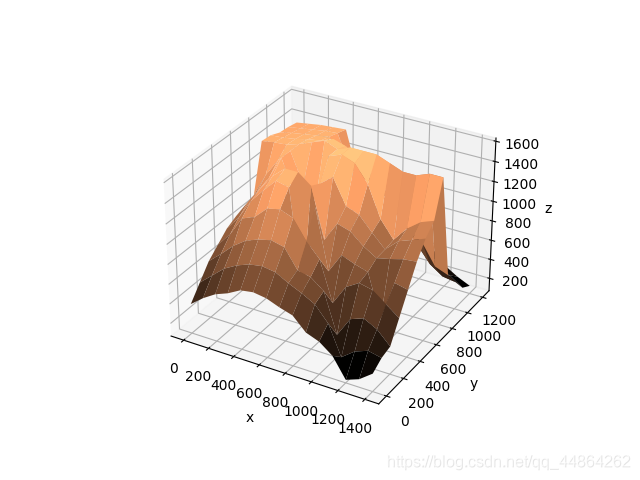
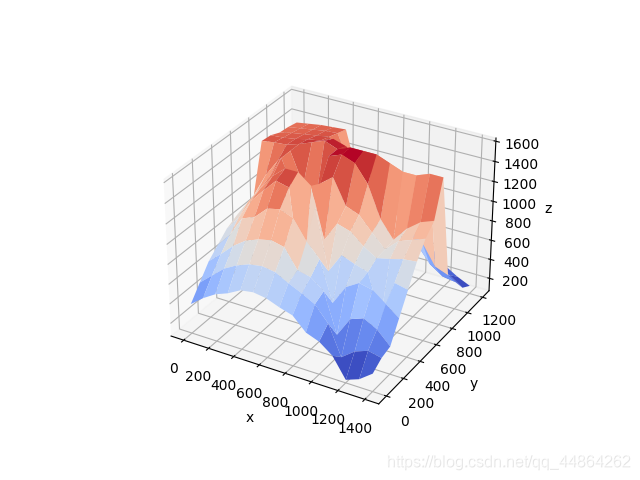
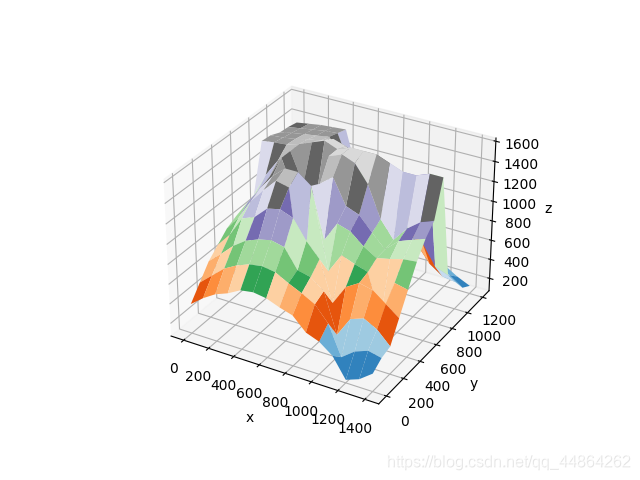
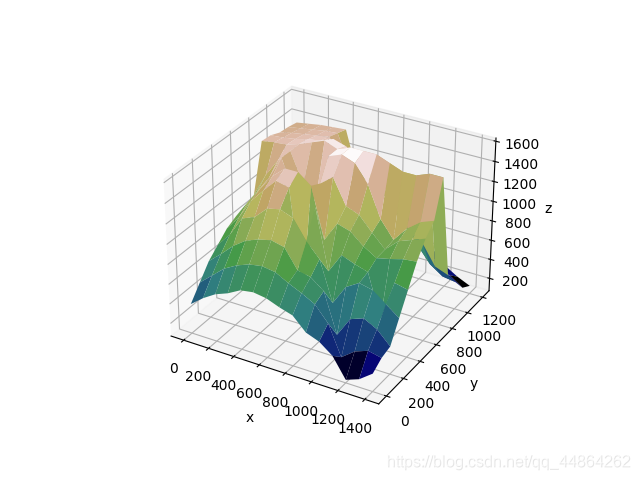
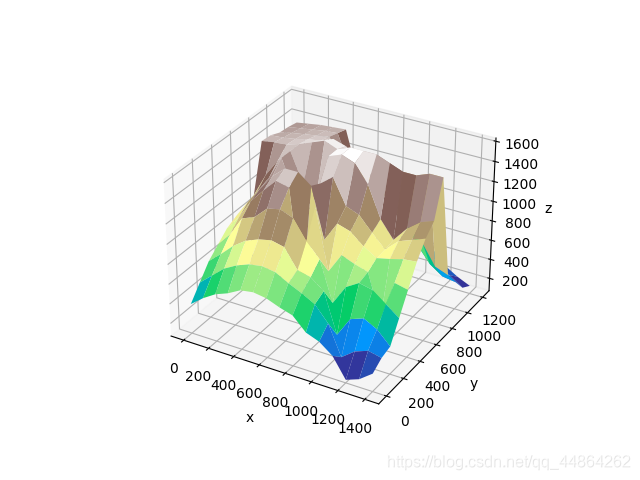
Sequential:
These colormaps are approximately monochromatic colormaps varying smoothly
between two color tones---usually from low saturation (e.g. white) to high
saturation (e.g. a bright blue). Sequential colormaps are ideal for
representing most scientific data since they show a clear progression from
low-to-high values.
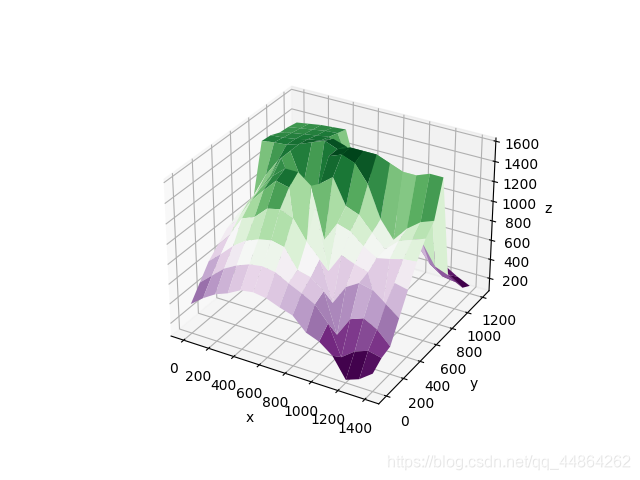
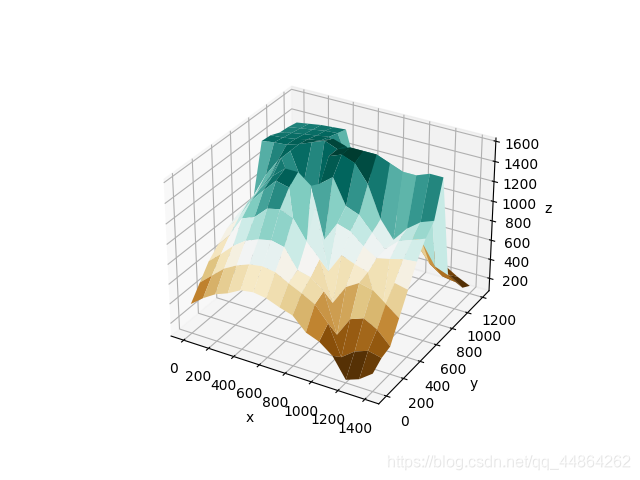
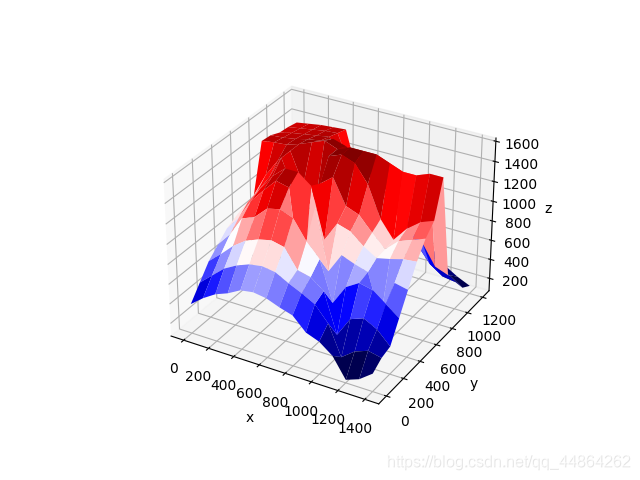
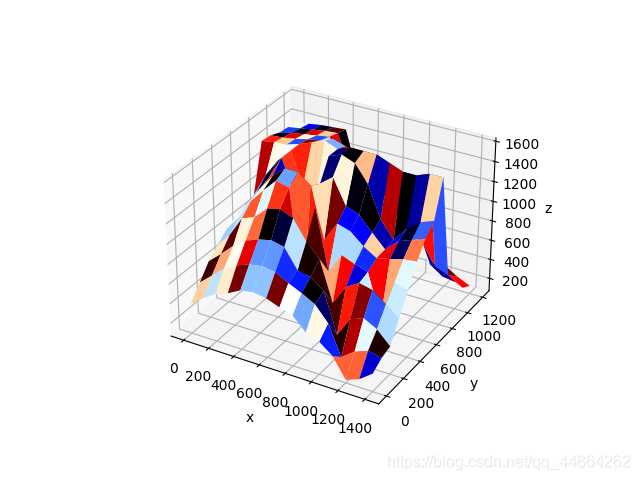
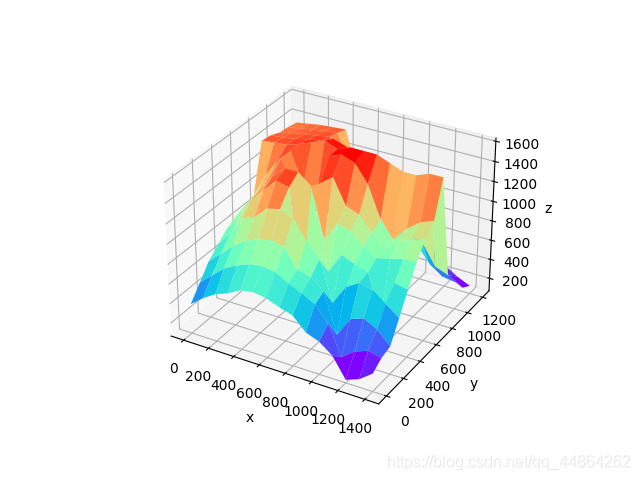
Diverging:
These colormaps have a median value (usually light in color) and vary
smoothly to two different color tones at high and low values. Diverging
colormaps are ideal when your data has a median value that is significant
(e.g. 0, such that positive and negative values are represented by
different colors of the colormap).
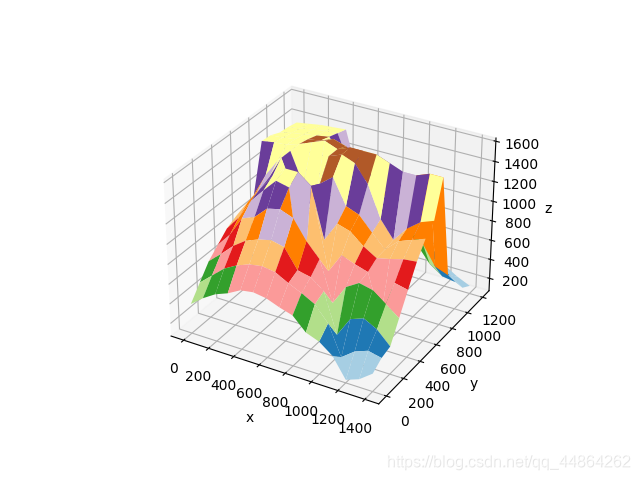
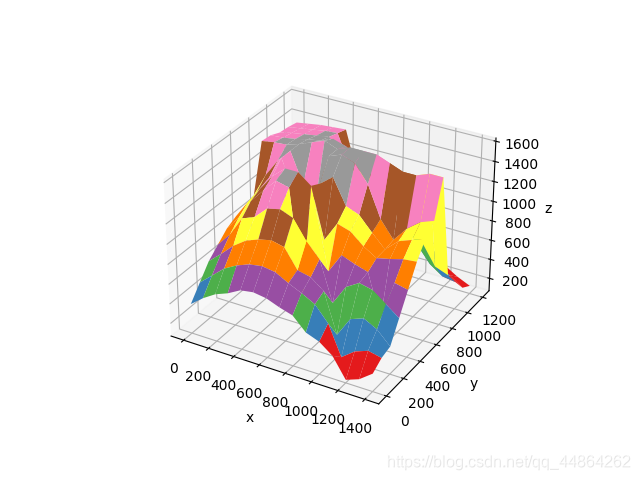
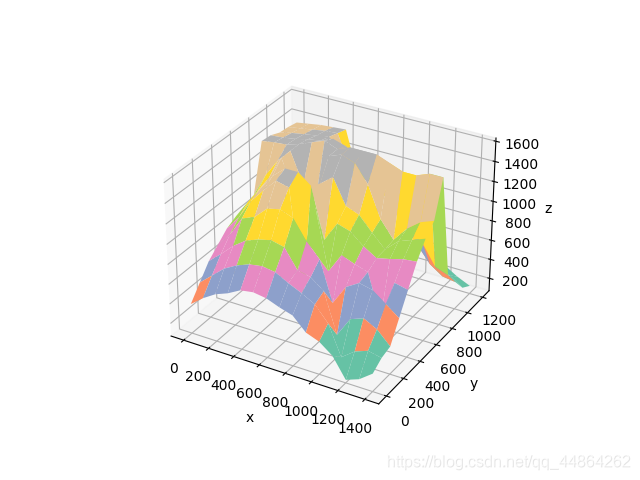
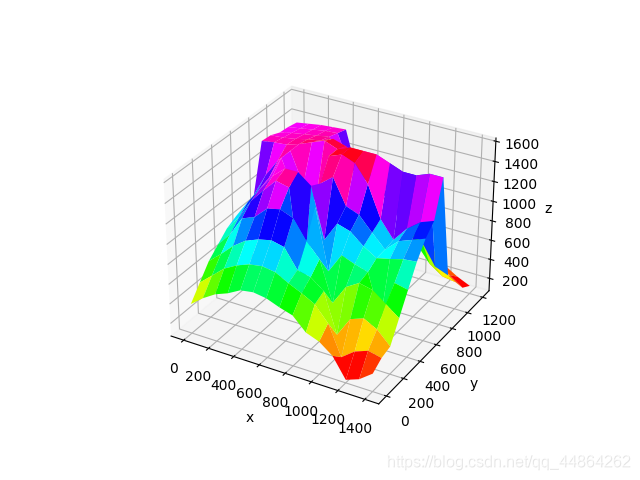
Qualitative:
These colormaps vary rapidly in color. Qualitative colormaps are useful for
choosing a set of discrete colors. For example::
color_list = plt.cm.Set3(np.linspace(0, 1, 12))
gives a list of RGB colors that are good for plotting a series of lines on
a dark background.
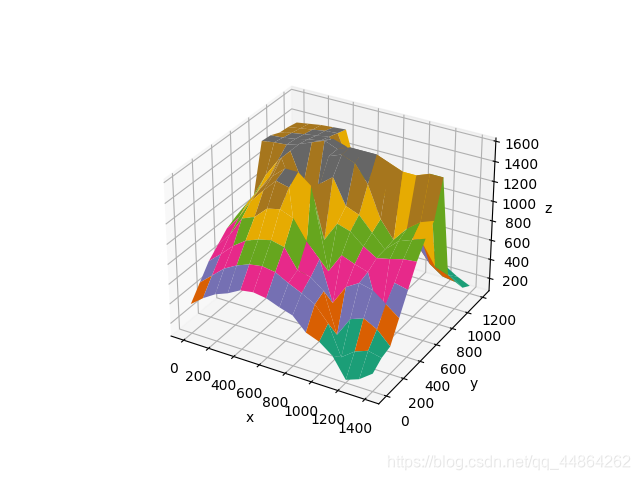
Miscellaneous:
Colormaps that don't fit into the categories above.
"""import numpy as np
import matplotlib.pyplot as plt
# Have colormaps separated into categories:# http://matplotlib.org/examples/color/colormaps_reference.html
cmaps =[('Perceptually Uniform Sequential',['viridis','plasma','inferno','magma']),('Sequential',['Greys','Purples','Blues','Greens','Oranges','Reds','YlOrBr','YlOrRd','OrRd','PuRd','RdPu','BuPu','GnBu','PuBu','YlGnBu','PuBuGn','BuGn','YlGn']),('Sequential (2)',['binary','gist_yarg','gist_gray','gray','bone','pink','spring','summer','autumn','winter','cool','Wistia','hot','afmhot','gist_heat','copper']),('Diverging',['PiYG','PRGn','BrBG','PuOr','RdGy','RdBu','RdYlBu','RdYlGn','Spectral','coolwarm','bwr','seismic']),('Qualitative',['Pastel1','Pastel2','Paired','Accent','Dark2','Set1','Set2','Set3','tab10','tab20','tab20b','tab20c']),('Miscellaneous',['flag','prism','ocean','gist_earth','terrain','gist_stern','gnuplot','gnuplot2','CMRmap','cubehelix','brg','hsv','gist_rainbow','rainbow','jet','nipy_spectral','gist_ncar'])]
nrows =max(len(cmap_list)for cmap_category, cmap_list in cmaps)
gradient = np.linspace(0,1,256)
gradient = np.vstack((gradient, gradient))defplot_color_gradients(cmap_category, cmap_list, nrows):
fig, axes = plt.subplots(nrows=nrows)
fig.subplots_adjust(top=0.95, bottom=0.01, left=0.2, right=0.99)
axes[0].set_title(cmap_category +' colormaps', fontsize=14)for ax, name inzip(axes, cmap_list):
ax.imshow(gradient, aspect='auto', cmap=plt.get_cmap(name))
pos =list(ax.get_position().bounds)
x_text = pos[0]-0.01
y_text = pos[1]+ pos[3]/2.
fig.text(x_text, y_text, name, va='center', ha='right', fontsize=10)# Turn off *all* ticks & spines, not just the ones with colormaps.for ax in axes:
ax.set_axis_off()for cmap_category, cmap_list in cmaps:
plot_color_gradients(cmap_category, cmap_list, nrows)
plt.show()