本文是 python pandas 教学,入门介绍 的继续,主要介绍pandas 的过滤,排序,分组统计,子集。
过滤
import pandas as pd
data = {
    'apples': [3, 2, 0, 1],
    'oranges': [0, 3, 7, 2]
}
purchases = pd.DataFrame(data)
purchases = pd.DataFrame(data, index=['June', 'Robert', 'Lily', 'David'])
fd=purchases[purchases['apples']>=2]
print(fd)
结果为:
apples oranges
June 3 0
Robert 2 3
复杂一点的过滤,自定义函数和lambda
import pandas as pd
data = {
    'apples': [3, 2, 0, 1],
    'oranges': [0, 3, 7, 2]
}
def add(x, y):
    return (x + y)

purchases = pd.DataFrame(data)
purchases = pd.DataFrame(data, index=['June', 'Robert', 'Lily', 'David'])


fd=purchases[purchases['apples']>=2]
fd2=purchases[add(purchases['apples'],purchases['oranges'])>=5]
df3=purchases[lambda x:x['apples']+x['oranges']<5]
print(fd2)
显示为:
apples oranges
Robert 2 3
Lily 0 7
df3
Out[150]:
apples oranges
June 3 0
David 1 2
排序
继续上面数据的例子:
按照apples多少排序,缺省是从小到大
df.sort_values(by=['apples'], inplace=True)
显示如下:
apples oranges
Lily 0 7
David 1 2
Robert 2 3
June 3 0
反序要怎么写呢?
df.sort_values(by=['apples'], inplace=True, ascending=False)
显示结果:
apples oranges
June 3 0
Robert 2 3
David 1 2
Lily 0 7
排序也可以多列,如下:
df.sort_values(by=['apples','oranges'], inplace=True)
这里先按apples排,相同情况下按oranges排, 这里数据少,apples也都不同,所以和上面结果一样。
分组,统计
参考:https://www.shanelynn.ie/summarising-aggregation-and-grouping-data-in-python-pandas/
# Group the data frame by month and item and extract a number of stats from each group
data.groupby(
    ['month', 'item']
).agg(
    {
        # Find the min, max, and sum of the duration column
        'duration': [min, max, sum],
        # find the number of network type entries
        'network_type': "count",
        # minimum, first, and number of unique dates
        'date': [min, 'first', 'nunique']
    }
)
下面图片说明,但我按他输入代码,不对一样。

但下面代码方式我测试过了的。
data[data['item'] == 'call'].groupby('month').agg(
    # Get max of the duration column for each group
    max_duration=('duration', max),
    # Get min of the duration column for each group
    min_duration=('duration', min),
    # Get sum of the duration column for each group
    total_duration=('duration', sum),
    # Apply a lambda to date column
    num_days=("date", lambda x: (max(x) - min(x)).days)
实际例子:
import pandas as pd

ipl_data = {'Team': ['Riders', 'Riders', 'Devils', 'Devils', 'Kings',
   'kings', 'Kings', 'Kings', 'Riders', 'Royals', 'Royals', 'Riders'],
   'Rank': [1, 2, 2, 3, 3,4 ,1 ,1,2 , 4,1,2],
   'Year': [2014,2015,2014,2015,2014,2015,2016,2017,2016,2014,2015,2017],
   'Points':[876,789,863,673,741,812,756,788,694,701,804,690]}
df = pd.DataFrame(ipl_data)

grouped = df.groupby('Year')

for name,group in grouped:
   print(name)
   print(group)
显示结果:
2014
Team Rank Year Points
0 Riders 1 2014 876
2 Devils 2 2014 863
4 Kings 3 2014 741
9 Royals 4 2014 701
2015
Team Rank Year Points
1 Riders 2 2015 789
3 Devils 3 2015 673
5 kings 4 2015 812
10 Royals 1 2015 804
2016
Team Rank Year Points
6 Kings 1 2016 756
8 Riders 2 2016 694
2017
Team Rank Year Points
7 Kings 1 2017 788
11 Riders 2 2017 690
子集
下面图片来自:https://www.shanelynn.ie/select-pandas-dataframe-rows-and-columns-using-iloc-loc-and-ix/
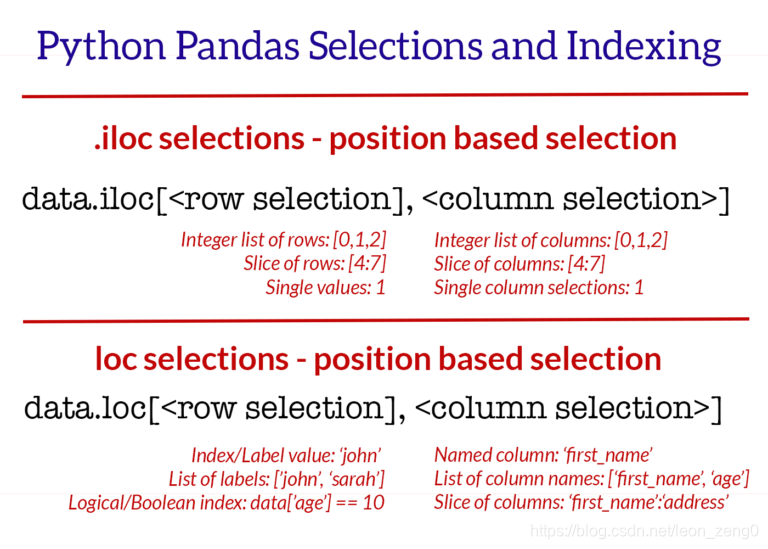
下面操作需要先运行group 的那个例子。
df.iloc[[0,3,6], [0,2,3]]
Out[36]:
Team Year Points
0 Riders 2014 876
3 Devils 2015 673
6 Kings 2016 756
df.iloc[:, [0,2,3]]
Out[37]:
Team Year Points
0 Riders 2014 876
1 Riders 2015 789
2 Devils 2014 863
3 Devils 2015 673
4 Kings 2014 741
5 kings 2015 812
6 Kings 2016 756
7 Kings 2017 788
8 Riders 2016 694
9 Royals 2014 701
10 Royals 2015 804
11 Riders 2017 690
df.iloc[:, 0:2]
Out[38]:
Team Rank
0 Riders 1
1 Riders 2
2 Devils 2
3 Devils 3
4 Kings 3
5 kings 4
6 Kings 1
7 Kings 1
8 Riders 2
9 Royals 4
10 Royals 1
11 Riders 2
df.loc[:5,['Team','Rank','Year']]
Out[49]:
Team Rank Year
0 Riders 1 2014
1 Riders 2 2015
2 Devils 2 2014
3 Devils 3 2015
4 Kings 3 2014
5 kings 4 2015
df.loc[:5]
Out[50]:
Team Rank Year Points
0 Riders 1 2014 876
1 Riders 2 2015 789
2 Devils 2 2014 863
3 Devils 3 2015 673
4 Kings 3 2014 741
5 kings 4 2015 812
其他
输出不显示index
答案链接:https://stackoverflow.com/questions/24644656/how-to-print-pandas-dataframe-without-index
答案是:
print(tmp.loc[:,['dateRep','cases','deaths']].to_string(index=False))
或者
print(tmp.to_string(index=False))
获取Pandas DataFrame的行索引值作为列表
答案链接:https://www.codenong.com/18358938/
答案:
df.index.values.tolist()