对图像进行滤波,可以有两种效果:
平滑滤波,用来抑制噪声;
微分算子,可以用来检测边缘和特征提取。
skimage库中通过filters模块进行滤波操作。
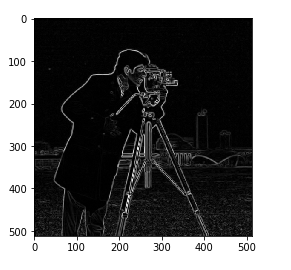
1. sobel算子
sobel算子可用来检测边缘。
函数调用:
skimage.filters.sobel(image, mask=None)
# 参数1,参数2
from skimage import data,filters
import matplotlib.pyplot as plt

img = data.camera()
edges = filters.sobel(img)
plt.imshow(edges,plt.cm.gray)
run result:
补充:
skimage.filters.sobel_h(img,mask=None) # 使用Sobel变换查找图像的水平边缘。
skimage.filters.sobel_v(img,mask=None) # 使用Sobel变换查找图像的垂直边缘。
2.roberts算子
roberts算子和sobel算子一样,可以用于检测检测边缘。
调用函数:
skimage.filters.roberts(img,mask=None) # 使用罗伯茨的交叉算子找出边缘量值。
skimage.filters.roberts_neg_diag(img,mask=None) # 使用Roberts的Cross运算符查找图像的交叉边缘。
skimage.filters.roberts_pos_diag(img,mask=None) # 使用Roberts的交叉算子找出图像的交叉边缘。
from skimage import data,filters
import matplotlib.pyplot as plt

img = data.camera()
edges = filters.roberts(img)
plt.imshow(edges,plt.cm.gray)
run result :

3. scharr算子
scharr算子也可用来检测边缘。
skimage.filters.scharr(img,mask=None) # 使用Scharr变换查找边缘量值。
skimage.filters.scharr_h(img,mask=None) # 使用Scharr变换查找图像的水平边缘。
skimage.filters.scharr_h(img,mask=None) # 使用Scharr变换查找图像的水平边缘。
from skimage import data,filters
import matplotlib.pyplot as plt

img = data.camera()
edges = filters.scharr(img)
plt.imshow(edges,plt.cm.gray)
run result:

4.prewitt算子
用来检测边缘
skimage.filters.scharr(img,mask=None)  # 使用Scharr变换查找边缘量值。
skimage.filters.scharr_h(img,mask=None) # 使用Scharr变换查找图像的水平边缘。
skimage.filters.scharr_h(img,mask=None) # 使用Scharr变换查找图像的水平边缘。
from skimage import data,filters
import matplotlib.pyplot as plt

img = data.camera()
edges = filters.prewitt(img)
plt.imshow(edges,plt.cm.gray)

5.canny算子
canny算子也是用于提取边缘特征,但它不是放在filters模块,而是放在feature模块
函数格式:
skimage.feature.canny(image,sigma=1.0)
from skimage import data,feature
import matplotlib.pyplot as plt
img = data.camera()
edges1 = feature.canny(img)   #sigma=1
edges2 = feature.canny(img,sigma=3)   #sigma=3 # 可以修改sigma的值来调整效果

plt.figure('canny',figsize=(8,8))
plt.subplot(121)
plt.imshow(edges1,plt.cm.gray)

plt.subplot(122)
plt.imshow(edges2,plt.cm.gray)

plt.show()
run result:

居然是黑色的???Oh,my god,我还不知道问题出现在哪里。。。。。
别人做的实验结果:

我还在找原因。。。。
终不是一帆风顺,历尽千帆,才能乘风破浪。
6.garbor滤波
用来进行边缘检测和纹理特征提取
函数调用:
skimage.filters.gabor(image, frequency)
# 通过修改frequency值来调整滤波效果,返回一对边缘结果,一个是用真实滤波核的滤波结果,一个是想象的滤波核的滤波结果
# 注意,是filters.garbor(),不是filters.garbor_filter()
# 我用的是skimage 0.15.0版本
from skimage import data,filters
import matplotlib.pyplot as plt
img = data.camera()
filt_real, filt_imag = filters.gabor(img,frequency=0.6)
# 注意,是filters.garbor(),不是filters.garbor_filter()
# 我用的是skimage 0.15.0版本
plt.figure('gabor',figsize=(8,8))

plt.subplot(121)
plt.title('filt_real')
plt.imshow(filt_real,plt.cm.gray)

plt.subplot(122)
plt.title('filt-imag')
plt.imshow(filt_imag,plt.cm.gray)

plt.show()
run result:
frequency=0.6

frequency=0.2

7.gaussian滤波:
多维的滤波器,是一种平滑滤波,可以消除高斯噪声
调用:
skimage.filters.gaussian(image, sigma)
from skimage import data,filters
import matplotlib.pyplot as plt
img = data.astronaut()
edges1 = filters.gaussian(img,sigma=0.5)   #sigma=0.4
edges2 = filters.gaussian(img,sigma=6)   #sigma=6

plt.figure('gaussian',figsize=(8,8))
plt.subplot(121)
plt.imshow(edges1,plt.cm.gray)

plt.subplot(122)
plt.imshow(edges2,plt.cm.gray)

plt.show()
run result:

8.中值滤波
中值滤波,一种平滑滤波,可以消除噪声
from skimage import data,filters
import matplotlib.pyplot as plt
from skimage.morphology import disk
# 需要用skimage.morphology模块来设置滤波器的形状。
img = data.camera()
edges1 = filters.median(img,disk(5))
edges2= filters.median(img,disk(9))

plt.figure('median',figsize=(8,8))

plt.subplot(121)
plt.imshow(edges1,plt.cm.gray)

plt.subplot(122)
plt.imshow(edges2,plt.cm.gray)

plt.show()
run result:

需要用skimage.morphology模块来设置滤波器的形状;
从结果可以看出,滤波器越大,图像越模糊。
9.水平、垂直边缘检测
上边所举的例子大都是进行全部边缘检测,有些时候我们只需要检测水平边缘,或垂直边缘,
在前面几个算子中,函数调用时也带过了,水平或者垂直检测的函数调用方法。
先总结如下:
水平边缘检测:sobel_h, prewitt_h, scharr_h
垂直边缘检测: sobel_v, prewitt_v, scharr_v
我们以sobel算子为例:
from skimage import data,filters
import matplotlib.pyplot as plt
img = data.camera()
edges1 = filters.sobel_h(img)
edges2 = filters.sobel_v(img)

plt.figure('sobel_v_h',figsize=(8,8))


plt.subplot(121)
plt.title('horizontal edge')
plt.imshow(edges1,plt.cm.gray)


plt.subplot(122)
plt.title('vertical edge')
plt.imshow(edges2,plt.cm.gray)

plt.show()
run result:
左图为检测出的水平边缘,右图为检测出的垂直边缘

10.交叉边缘检测
可使用Roberts的十字交叉核来进行过滤,以达到检测交叉边缘的目的。这些交叉边缘实际上是梯度在某个方向上的一个分量
其中一个核;
0 1
-1 0
对应的函数为:
roberts_neg_diag(image)
from skimage import data,filters
import matplotlib.pyplot as plt
img =data.camera()
dst =filters.roberts_neg_diag(img)

plt.figure('filters',figsize=(8,8))
plt.subplot(121)
plt.title('origin image')
plt.imshow(img,plt.cm.gray)

plt.subplot(122)
plt.title('filted image')
plt.imshow(dst,plt.cm.gray)
run result :

另一个核:
1 0
0 -1
对应的函数:
roberts_pos_diag(image)
把上面的第四行代码改为: dst =filters.roberts_pos_diag(img)
run result:

以上内容是参考下面的链接做的代码实现。
总结,在做题或者面试的时候,出现比较多是:
均值滤波:利用点(x,y)领域内像素点均值来替换(x,y)处像素值;
中值滤波:利用点(x,y)领域内像素点中值来替换(x,y)处像素值;
参考和引用:
https://scikit-image.org/docs/0.13.x/api/skimage.filters.html(scikit-image网)
https://cloud.tencent.com/developer/section/1414823(腾讯云上的,值得查看)
https://www.cnblogs.com/denny402/p/5125253.html
https://blog.csdn.net/denny2015/article/details/50581791
https://blog.csdn.net/qq_36941368/article/details/82998296#_49
https://blog.csdn.net/sinat_31425585/article/details/78522897
仅用来个人学习和分享,如有错误,请指正。
如若侵权,留言立删。
尊重他人知识产权,不做拿来主义者!
喜欢的可以关注我哦QAQ,
你的关注和喜欢就是我write博文的动力