1:折线图
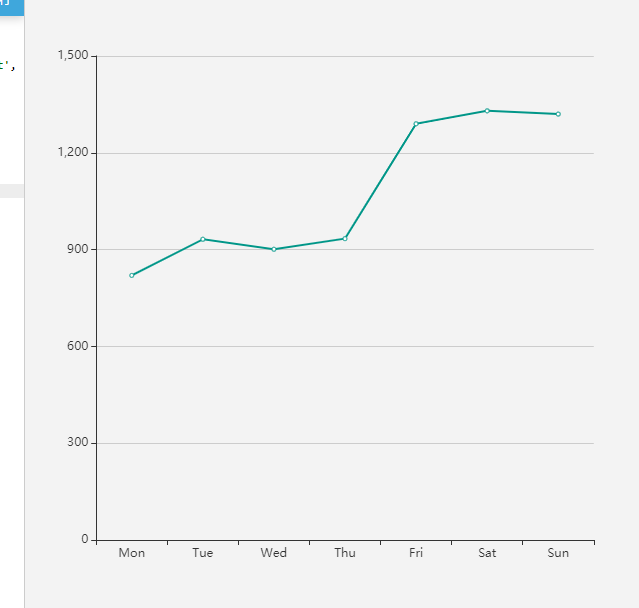
①:单条折线
在与series同级的地方放置color数组:
如图 :

效果如图
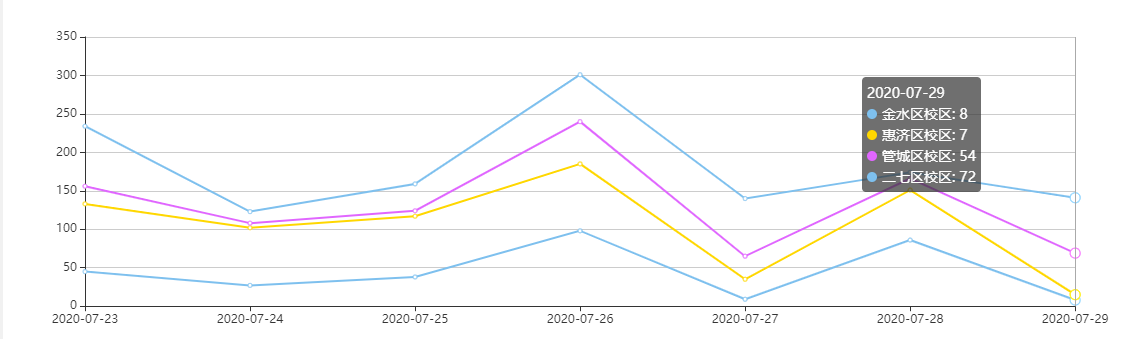
②:多条折线:
同理在与series同级的地方放置color数组:例如
color: ["#7EC0EE", "#FF9F7F", "#FFD700", "#C9C9C9", "#E066FF", "#C0FF3E"],其中:当颜色不够时,会从第一个颜色再次开始遍历。
效果如图:
2:饼状图:颜色设置同上
效果图:
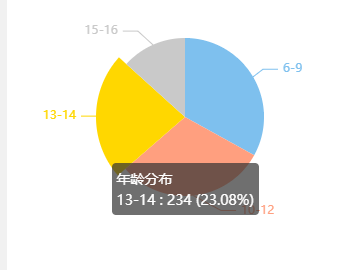
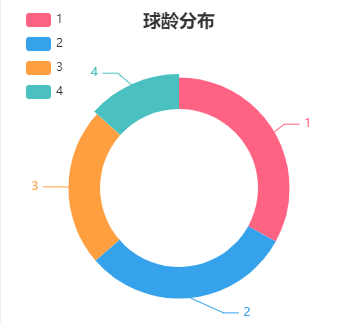
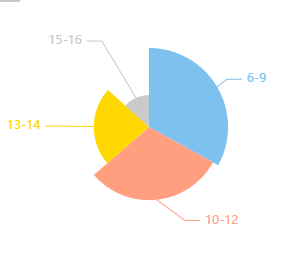
主要注意形态变化:
series: [
          {
            name: this.title,
            type: "pie",
            radius: "50%",
            radius: ["50%", "70%"], //环形图
            center: ["50%", "70%"], //饼图
            roseType: "radius",//外边距不一的环形图 如上图
            data: this.data,
            color: this.color,
            emphasis: {
              itemStyle: {
                shadowBlur: 10,
                shadowOffsetX: 0,
                shadowColor: "rgba(0, 0, 0, 0.5)",
              },
            },
          },
        ],
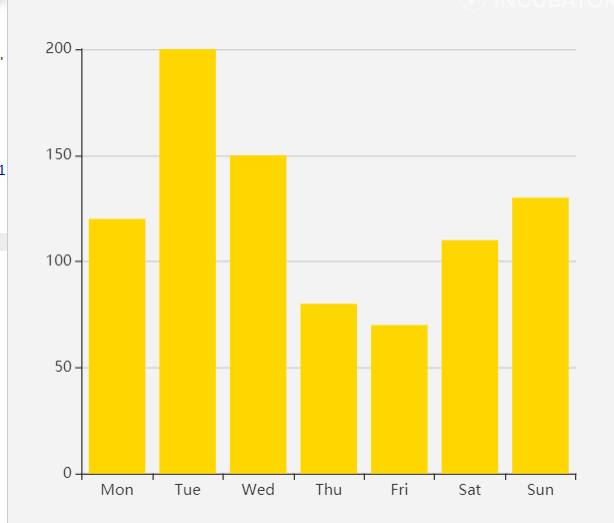
3:柱状图
①:单条柱状图;
series: [{
        data: [120, 200, 150, 80, 70, 110, 130],
        type: 'bar',
        itemStyle: {
              normal: {
                color:"#FFD700",
              },
            },
    }]
效果如图
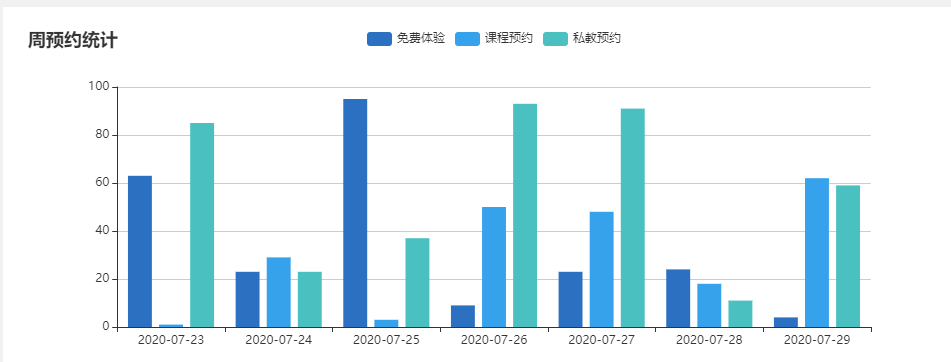
②多条折线
  series: [
          {
            type: "bar",
            itemStyle: {
              normal: {
                color: “#2C71C1”,
              },
            },
          },
          {
            type: "bar",
            itemStyle: {
              normal: {
                color: “#36A2EB”,
              },
            },
          },
          {
            type: "bar",
            itemStyle: {
              normal: {
                color: “#4BC0C0”,
              },
            },
          },
        ],
效果:
暂时先写三种较为常用的,以后有用到别的再改