GitHub Demo 地址
在线预览
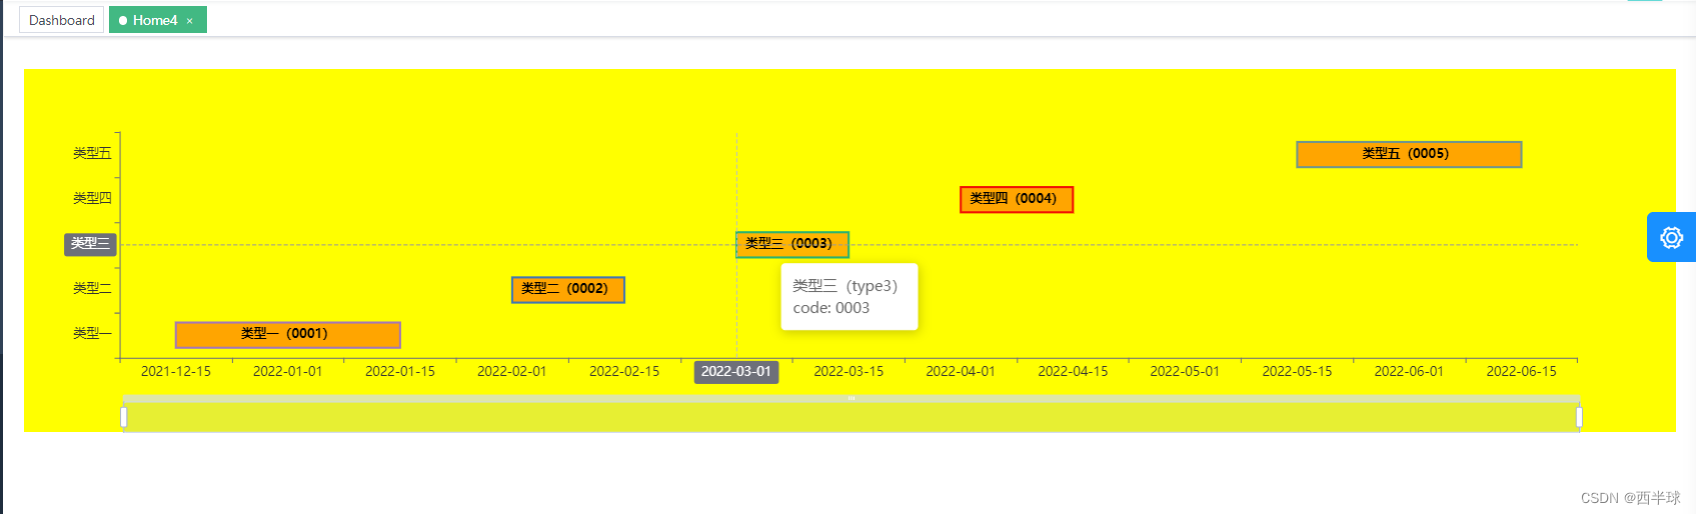
参考:echarts renderItem-在区间段内展示连续数据
效果图
跟随窗口变化刷新chart
 // 跟随窗口变化刷新chart
 var that = this
 window.addEventListener('resize', () => {


   that.myChart2.resize()
 })
柱子点击事件,点击柱形中有数据的部分生效,而对于没有数据的区域,点击无效
 var that = this
 // 柱子点击事件,点击柱形中有数据的部分生效,而对于没有数据的区域,点击无效
 this.myChart2.on('click', function(params) {


   const data = params.data
   console.log(JSON.stringify(data))
   that.dialogText = data.name + '(' + data.type + '),' + 'code: ' + data.code
   that.dialogVisible = true
 })
全部代码
<template>
  <div class="app-container">
    <div style="margin:10px" />
    <div class="chart-bg">
      <div id="myChart2" class="charts" />
    </div>

    <el-dialog :visible.sync="dialogVisible" title="提示" width="30%">
      <span>点击了:{

    {

     dialogText }}</span>
      <span slot="footer" class="dialog-footer">
        <el-button @click="dialogVisible = false">取 消</el-button>
        <el-button type="primary" @click="dialogVisible = false">确 定</el-button>
      </span>
    </el-dialog>
  </div>
</template>

<script>
import * as echarts from 'echarts'

export default {


  components: {

    },
  data() {


    return {


      myChart2: null,
      dialogVisible: false,
      dialogText: ''
    }
  },
  created() {

    },
  mounted() {


    this.init_echarts2()
    this.requestChartData2()
  },
  methods: {


    // 初始化chart
    init_echarts2() {


      var chartData = {


        xData: ['2022-01-01', '2022-02-01', '2022-03-01', '2022-04-01', '2022-05-15'],
        yData: ['类型一', '类型二', '类型三', '类型四', '类型五'],
        listData: []
      }
      this.myChart2 = echarts.init(document.getElementById('myChart2'))
      this.myChart2.setOption(this.getOption2(chartData, 1))
      // 跟随窗口变化刷新chart
      var that = this
      window.addEventListener('resize', () => {


        that.myChart2.resize()
      })
      // 柱子点击事件,点击柱形中有数据的部分生效,而对于没有数据的区域,点击无效
      this.myChart2.on('click', function(params) {


        const data = params.data
        console.log(JSON.stringify(data))
        that.dialogText = data.name + '(' + data.type + '),' + 'code: ' + data.code
        that.dialogVisible = true
      })
    },
    getOption2(chartData, type) {


      var option = {


        grid: {

     left: '3%', right: '6%', bottom: '15%', containLabel: true },
        tooltip: {


          trigger: 'axis',
          axisPointer: {


            type: 'cross'
          },
          formatter: function(params) {


            const data = params[0].data
            return data.name + '(' + data.type + ')' + '<br/>' + 'code: ' + data.code
          }
        },
        xAxis: [{

     data: chartData.xData, axisLabel: {

     color: '#333' }}],
        yAxis: [{

     data: chartData.yData, axisLabel: {

     color: '#333' }}],
        // dataZoom: [{}],
        dataZoom: [
          {

     type: 'slider', bottom: '2%' }, // 有单独的滑动条,用户在滑动条上进行缩放或漫游
          {

     type: 'inside', bottom: '2%' } // 内置于坐标系中,用户在坐标系上通过鼠标拖拽、鼠标滚轮、手指滑动(触屏上)来缩放或漫游坐标系
        ],
        series: [
          {


            type: 'custom',
            renderItem: function(params, api) {


              const data = chartData.listData[api.value(0)]
              const text = data.name + '(' + data.code + ')'
              const color = data.bgColor

              var categoryIndex = api.value(0)
              var start = api.coord([api.value(1), categoryIndex])
              var end = api.coord([api.value(2), categoryIndex])
              var height = 24

              return {


                type: 'rect',
                shape: echarts.graphic.clipRectByRect(
                  {


                    x: start[0],
                    y: start[1] - height / 2,
                    width: end[0] - start[0],
                    height: height
                  },
                  {


                    x: params.coordSys.x,
                    y: params.coordSys.y,
                    width: params.coordSys.width,
                    height: params.coordSys.height
                  }
                ),
                // 柱状图样式设置,方式二,同时设置优先级高于方式一
                // style: api.style()
                style: api.style({


                  text: text, // 文字
                  fill: 'orange', // 背景色
                  // stroke: 'black', // 边框颜色
                  stroke: color,
                  lineWidth: 2, // 边框宽度
                  textFill: 'black', // 文字颜色
                  fontWeight: 'bold',
                  fontSize: '12',
                  opacity: 1
                })
              }
            },
            encode: {


              x: [1, 2],
              y: 0
            },
            data: chartData.listData,
            // 柱状图样式设置,方式一
            itemStyle: {


              // color: 'red', // 柱图背景色
              color: 'transparent',
              borderColor: 'red',
              borderWidth: 1
            },
            label: {


              show: true, // 开启显示
              // position: 'top', // 上方显示
              position: 'inside', // 内部显示
              textStyle: {


                color: 'green',
                fontSize: 15
              }
            }
          }
        ]
      }
      return option
    },
    requestChartData2() {


      // 间隔一致,保证开始结束时间都在x轴点上
      var chartData = {


        xData: [
          '2021-12-15',
          '2022-01-01',
          '2022-01-15',
          '2022-02-01',
          '2022-02-15',
          '2022-03-01',
          '2022-03-15',
          '2022-04-01',
          '2022-04-15',
          '2022-05-01',
          '2022-05-15',
          '2022-06-01',
          '2022-06-15'
        ],
        yData: ['类型一', '类型二', '类型三', '类型四', '类型五'],
        listData: [
          {

     name: '类型一', type: 'type1', code: '0001', startTime: '2021-12-15', endTime: '2022-01-15' },
          {

     name: '类型二', type: 'type2', code: '0002', startTime: '2022-02-01', endTime: '2022-02-15' },
          {

     name: '类型三', type: 'type3', code: '0003', startTime: '2022-03-01', endTime: '2022-03-15' },
          {

     name: '类型四', type: 'type4', code: '0004', startTime: '2022-04-01', endTime: '2022-04-15' },
          {

     name: '类型五', type: 'type5', code: '0005', startTime: '2022-05-15', endTime: '2022-06-15' }
        ]
      }
      chartData = this.handleData(chartData)
      // console.log(JSON.stringify(chartData));

      this.myChart2.showLoading()
      setTimeout(() => {


        this.myChart2.setOption(this.getOption2(chartData, 1), true)
        this.myChart2.hideLoading()
      }, 1000)
    },
    handleData(chartData) {


      var newChartData = JSON.parse(JSON.stringify(chartData))
      const newArr = newChartData.listData.map((item, index) => {


        return {


          name: item.name,
          value: [index, item.startTime, item.endTime], // index(0,1,2)代表y轴的索引,后两位代表x轴数据开始和结束
          type: item.type,
          code: item.code,
          startTime: item.startTime,
          endTime: item.endTime,
          bgColor: this.getRandomColor()
        }
      })
      newChartData.listData = newArr
      return newChartData
    },
    // 随机生成颜色
    getRandomColor() {


      let color = ''
      const r = Math.floor(Math.random() * 256)
      const g = Math.floor(Math.random() * 256)
      const b = Math.floor(Math.random() * 256)
      color = `rgb(${

      r},${

      g},${

      b})`
      return color // 所有方法的拼接都可以用ES6新特性`其他字符串{$变量名}`替换
    },
    getRandomColor2() {


      return '#' + Math.floor(Math.random() * (256 * 256 * 256 - 1)).toString(16)
    }
    // color: function() { return '#' + Math.floor(Math.random() * (256 * 256 * 256 - 1)).toString(16); },
  }
}
</script>
<style lang="scss" scoped>
.chart-bg {


  width: 100%;
  height: 40vh;
  background: yellow;
}

.charts {


  // width: 95%;
  width: 100%;
  height: 100%;
}
</style>