文章目录
ab命令介绍
ApacheBench(即ab)通常用来做网站性能压力测试,是性能调优过程中必不可少的一环,ab命令会创建很多的并发访问线程,模拟多个访问者同时对某一URL地址进行访问。它的测试目标是基于URL的,因此,既可以用来测试Apache的负载压力,也可以测试nginx、lighthttp、tomcat、IIS等其它Web服务器的压力。
ab命令对发出负载的计算机要求很低,既不会占用很多CPU,也不会占用太多的内存,但却会给目标服务器造成巨大的负载,因此是某些DDOS攻击之必备良药,使用请谨慎。
一般我们会使用ab命令在本地进行测试,比如使用内网的一台或者多台服务器通过内网进行测试,这样测试的数据会比较准确,如果是远程对web服务器进行压力测试,往往效果不理想。
ab命令的安装
[root@gaosh-1 ~]# rpm -qa |grep httpd
httpd-2.2.15-69.el6.centos.x86_64
httpd-tools-2.2.15-69.el6.centos.x86_64
这里的httpd-tools里面就包含了ab命令,所以如果没有安装httpd-tools,只需要使用yum进行安装即可
[root@gaosh-1 ~]# yum install httpd-tools
查看版本:
[root@gaosh-1 ~]# ab -V
This is ApacheBench, Version 2.3 <$Revision: 655654 $>
ab命令的参数
[root@gaosh-1 ~]# ab -h
Usage: ab [options] [http[s]://]hostname[:port]/path
Options are:
    -n requests     Number of requests to perform
        ### 要执行的请求数,本次测试总共要访问页面的次数
    -c concurrency  Number of multiple requests to make
       ### 一次产生的请求个数(默认是并发数)
    -t timelimit    Seconds to max. wait for responses
        #### 测试所进行的最大秒数。其内部隐含值是-n 50000。
       ###  它可以使对服务器的测试限制在一个固定的总   时间以内。默认时,没有时间限制

    -p postfile     File containing data to POST. Remember also to set -T
      ###包含了需要POST的数据的文件,文件格式如“p1=1&p2=2”.使用方法是 -p 111.txt 。 (配合-T)
    -u putfile      File containing data to PUT. Remember also to set -T
    -T content-type Content-type header for POSTing, eg.
                    'application/x-www-form-urlencoded'
                    Default is 'text/plain'
    -v verbosity    How much troubleshooting info to print
     ###设置显示信息的详细程度 – 4或更大值会显示头信息,
     ####3或更大值可以显示响应代码(404, 200等), 2或更大值可以显示警告和其他信息。

    -w              Print out results in HTML tables
        ####  以HTML表的格式输出结果。默认时,它是白色背景的两列宽度的一张表
    -i              Use HEAD instead of GET
       ####执行HEAD请求,而不是GET。

    -C attribute    Add cookie, eg. 'Apache=1234. (repeatable)

    -V              Print version number and exit
        ### 打印版本号

[root@gaosh-1 ~]#
参数比较多,但是我们用的最多的也就是 -n -c -t -p -w ,使用频繁度从左往右依次递减
使用举例
1. 使用gaosh-64服务器对gaosh-1服务器进行压测,模拟10个用户,对百度首页发起1000次请求
[root@gaosh-64 ~]# ab -n 1000 -c 10 http://192.168.1.22/index.php
在压测时候会显示被压测服务器的版本号
在gaosh-1 ip; 192.168.1.22上可以查看到访问的次数
[root@gaosh-1 html]# awk '{print $1}' /var/log/httpd/access_log |sort |uniq -c |sort -n -r
   1000 192.168.1.64
     69 192.168.1.4
可以看到192.168.1.64 访问了1000次。
扫描二维码关注公众号,回复:
11452100 查看本文章

其中 /var/log/httpd/access_log是 httpd的访问日志。
2. 压测www.zmkjedu.com
[root@gaosh-64 ~]# ab -n 100 -c 10 https://www.zmkjedu.com/index.php
后面除了跟ip外,还可以跟域名进行压测
压测时的信息详解
[root@gaosh-64 ~]# ab -n 1000 -c 10 http://192.168.1.22/index.php
#### ab相关的版本信息
This is ApacheBench, Version 2.3 <$Revision: 1430300 $>
Copyright 1996 Adam Twiss, Zeus Technology Ltd, http://www.zeustech.net/
Licensed to The Apache Software Foundation, http://www.apache.org/
##### 并发数10,每次100个请求, 每次访问量是1000
Benchmarking 192.168.1.22 (be patient)
Completed 100 requests
Completed 200 requests
Completed 300 requests
Completed 400 requests
Completed 500 requests
Completed 600 requests
Completed 700 requests
Completed 800 requests
Completed 900 requests
Completed 1000 requests
Finished 1000 requests
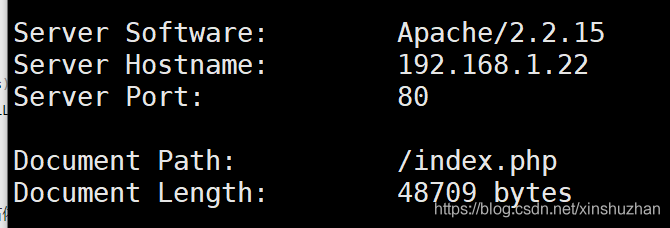
#### 被压测服务器的相关信息
Server Software: Apache/2.2.15 ### apache版本号
Server Hostname: 192.168.1.22 #### 被压测方IP
Server Port: 80 ### 被压测服务器端口
Document Path: /index.php
Document Length: 48709 bytes ### 请求文件的大小
Concurrency Level: 10 #### 并发级别,一次10
Time taken for tests: 1.186 seconds ### 本次压测消耗的时间
Complete requests: 1000 ####一共发起的总请求数
Failed requests: 0 ### 失败请求量
Write errors: 0
Total transferred: 48881000 bytes ### 总共传输的数据量
HTML transferred: 48709000 bytes 从服务器接收到的index.html文件的总大小
Requests per second: 843.21 [#/sec] (mean)
Time per request: 11.859 [ms] (mean) 每秒完成的请求数:QPS ,并发
Time per request: 1.186 [ms] (mean, across all concurrent requests)
Transfer rate: 40250.90 [Kbytes/sec] received
Connection Times (ms) ### 相应时间
min mean[+/-sd] median max
Connect: 0 1 3.4 0 45
Processing: 2 10 9.9 7 75
Waiting: 1 6 7.4 4 47
Total: 2 12 10.8 7 81
Percentage of the requests served within a certain time (ms)
50% 7
66% 9
75% 12
80% 16
90% 25
95% 35
98% 48
99% 49
100% 81 (longest request)
##### 表示50%的请求是在7秒钟完成的,99%的请求,小于49秒。
总结
ab工具是一个很好用的压测工具,当然压测工具还有很多,后期我会一一介绍,今天就先到这里吧,哦们现在再见。