Delaunay Triangulation and Voronoi Diagram using OpenCV ( C++ / Python )
NOVEMBER 5, 2015 55 COMMENTS
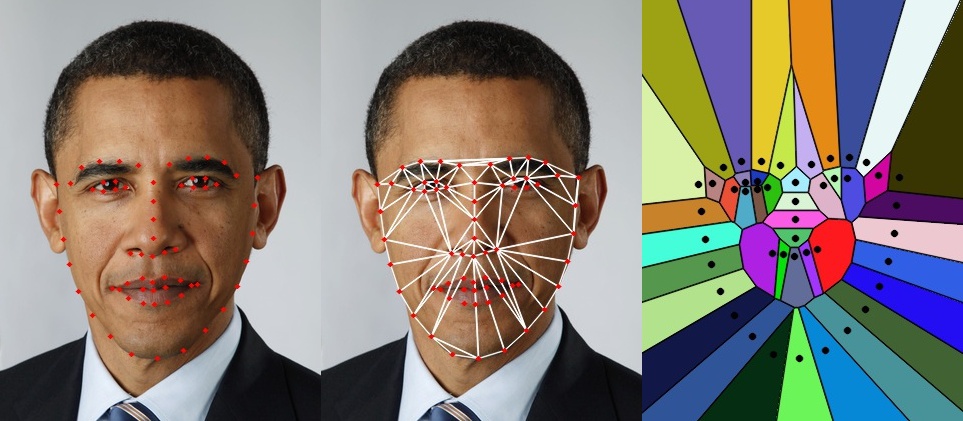
Figure 1. Left : Image of President Obama with landmarks detected using dlib. Center : Delaunay triangulation of the landmarks. Right : Corresponding Voronoi Diagram.
In a previous post I had discussed two libraries for facial landmark detection, and had pointed to several interesting applications like Face Morphing, Face Replacement etc. that use facial landmarks. In many such applications a triangulation of facial landmarks is first found (See Figure 1), and these triangles are warped to do something interesting. This post will help us understand Delaunay triangulation and Voronoi diagrams ( a.k.a Voronoi tesselation, Voronoi decomposition, Voronoi partition, and Dirichlet tessellation ), and help us uncover a barely documented function in OpenCV.
Boris Nikolaevich Delaunay, a Russian mathematician, spelled his last name in two different ways — Delaunay, for French and German publications, and Delone elsewhere. Few people have algorithms or concepts named after them. But Delaunay has one mathematical concept named after each spelling of his last name! — Delaunay Triangulation and Delone Sets. As if all this was not enough, by 1913, he became one of the top three Russian mountain climbers!
Delaunay’s Ph.D. advisor was Georgy Voronoy after whom the Voronoi Diagrams are named. And here is another interesting bit of trivia — Voronoy’s Ph.D. advisor was Andrey Markov (yes, yes Markov of Markov chains, and Markov processes fame).
What is Delaunay Triangulation ?
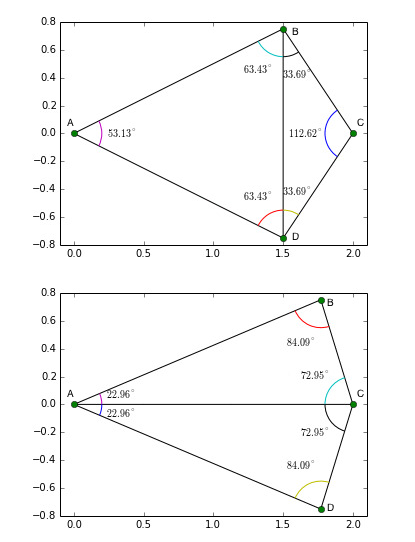
Figure 2 : Delaunay triangulation favors small angles
Given a set of points in a plane, a triangulation refers to the subdivision of the plane into triangles, with the points as vertices. In Figure 1, we see a set of landmarks on the left image, and the triangulation in the middle image. A set of points can have many possible triangulations, but Delaunay triangulation stands out because it has some nice properties. In a Delaunay triangulation, triangles are chosen such that no point is inside the circumcircle of any triangle. Figure 2. shows Delaunay triangulation of 4 points A, B, C and D. In the top image, for the triangulation to be a valid Delaunay triangulation, point C should be outside the circumcircle of triangle ABD, and point A should be outside the circumcircle of triangle BCD.
An interesting property of Delaunay triangulation is that it does not favor “skinny” triangles ( i.e. triangles with one large angle ).
Figure 2 shows how the triangulation changes to pick “fat” triangles when the points are moved. In the top image, the points B and D have their x-coordinates at x = 1.5, and in the bottom image they are moved to the right to x = 1.75. In the top image angles ABC and ABD are large, and Delaunay triangulation creates an edge between B and D splitting the two large angles into smaller angles ABD, ADB, CDB, and CBD. On the other hand in the bottom image, the angle BCD is too large, and Delaunay triangulation creates an edge AC to divide the large angle.
There are many algorithms to find the Delaunay triangulation of a set of points. The most obvious ( but not the most efficient ) one is to start with any triangulation, and check if the circumcircle of any triangle contains another point. If it does, flip the edges ( as show in Figure 2. ) and continue until there are no triangles whose circumcircle contains a point.
Any discussion on Delaunay triangulation has to include Voronoi diagrams because the Voronoi diagram of a set of points is mathematical dual to its Delaunay triangulation.
What is a Voronoi Diagram ?
Figure 3. Voronoi Diagram
Given a set of points in a plane, a Voronoi diagram partitions the space such that the boundary lines are equidistant from neighboring points. Figure 3. shows an example of a Voronoi diagram calculated from the points shown as black dots. You will notice that every boundary line passes through the center of two points. If you connect the points in neighboring Voronoi regions, you get a Delaunay triangulation!
Delaunay triangulation and Voronoi diagram are related in more ways than one. Georgy Voronoy, the mathematician after which Voronoi diagram is named, was Boris Delaunay’s Ph.D. advisor.
Delaunay Triangulation & Voronoi Diagram in OpenCV
Given a set of points, you can calculate the Delaunay Triangulation or Voronoi Diagram using the class Subdiv2D. Here are the steps. A complete working example is shown in the next section.
- Collect all the points in a vector.
C++vector<Point2f> points; // This is how you can add one point. points.push_back(Point2f(x,y));
Python
points = []
# This is how you can add one point.
points.append((x, y))
- Define the space you want to partition using a rectangle (rect). If the points you have defined in the previous step are defined on an image, this rectangle can be ( 0, 0, width, height ). Otherwise, you can choose a rectangle that bounds all the points.
C++
Mat img = imread("image.jpg");
Size size = img.size();
Rect rect(0, 0, size.width, size.height);
Python
img = cv2.imread("image.jpg"); size = img.shape rect = (0, 0, size[1], size[0]) - Create an instance of Subdiv2D with the rectangle obtained in the previous step.
C++Subdiv2D subdiv(rect);
Python
subdiv = cv2.Subdiv2D(rect);
- Insert the points into subdiv using subdiv.insert(point). The video above shows an animation of triangulation as we add points to subdiv.
- Use subdiv.getTriangleList to get a list of Delaunay triangles.
- Use subdiv.getVoronoiFacetList to get the list of Voronoi facets.
OpenCV Example for Delaunay Triangulation & Voronoi Diagram
Here is a complete working example. I have copied some of this code from examples that come with OpenCV and simplified and modified it to suit our purpose. The python example that comes with OpenCV uses the old (and ugly) interface, and so I wrote it from scratch. This code assumes an image is stored in image.jpg and the points are stored in points.txt. Each row of points.txt contains the x and y coordinates of a point separated by a space. E.g.
207 242
210 269
214 297
220 322
229 349
You can also download this code along with the associated data ( obama example in this post ) by subscribing to our newsletter here.
C++ Example
#include <opencv2/imgproc/imgproc.hpp>
#include <opencv2/highgui/highgui.hpp>
#include <iostream>
#include <fstream>

using namespace cv;
using namespace std;

// Draw a single point
static void draw_point( Mat& img, Point2f fp, Scalar color )
{
    circle( img, fp, 2, color, CV_FILLED, CV_AA, 0 );
}

// Draw delaunay triangles
static void draw_delaunay( Mat& img, Subdiv2D& subdiv, Scalar delaunay_color )
{

    vector<Vec6f> triangleList;
    subdiv.getTriangleList(triangleList);
    vector<Point> pt(3);
    Size size = img.size();
    Rect rect(0,0, size.width, size.height);

    for( size_t i = 0; i < triangleList.size(); i++ )
    {
        Vec6f t = triangleList[i];
        pt[0] = Point(cvRound(t[0]), cvRound(t[1]));
        pt[1] = Point(cvRound(t[2]), cvRound(t[3]));
        pt[2] = Point(cvRound(t[4]), cvRound(t[5]));

        // Draw rectangles completely inside the image.
        if ( rect.contains(pt[0]) && rect.contains(pt[1]) && rect.contains(pt[2]))
        {
            line(img, pt[0], pt[1], delaunay_color, 1, CV_AA, 0);
            line(img, pt[1], pt[2], delaunay_color, 1, CV_AA, 0);
            line(img, pt[2], pt[0], delaunay_color, 1, CV_AA, 0);
        }
    }
}

//Draw voronoi diagram
static void draw_voronoi( Mat& img, Subdiv2D& subdiv )
{
    vector<vector<Point2f> > facets;
    vector<Point2f> centers;
    subdiv.getVoronoiFacetList(vector<int>(), facets, centers);

    vector<Point> ifacet;
    vector<vector<Point> > ifacets(1);

    for( size_t i = 0; i < facets.size(); i++ )
    {
        ifacet.resize(facets[i].size());
        for( size_t j = 0; j < facets[i].size(); j++ )
            ifacet[j] = facets[i][j];

        Scalar color;
        color[0] = rand() & 255;
        color[1] = rand() & 255;
        color[2] = rand() & 255;
        fillConvexPoly(img, ifacet, color, 8, 0);

        ifacets[0] = ifacet;
        polylines(img, ifacets, true, Scalar(), 1, CV_AA, 0);
        circle(img, centers[i], 3, Scalar(), CV_FILLED, CV_AA, 0);
    }
}


int main( int argc, char** argv)
{

    // Define window names
    string win_delaunay = "Delaunay Triangulation";
    string win_voronoi = "Voronoi Diagram";

    // Turn on animation while drawing triangles
    bool animate = true;

    // Define colors for drawing.
    Scalar delaunay_color(255,255,255), points_color(0, 0, 255);

    // Read in the image.
    Mat img = imread("image.jpg");

    // Keep a copy around
    Mat img_orig = img.clone();

    // Rectangle to be used with Subdiv2D
    Size size = img.size();
    Rect rect(0, 0, size.width, size.height);

    // Create an instance of Subdiv2D
    Subdiv2D subdiv(rect);

    // Create a vector of points.
    vector<Point2f> points;

    // Read in the points from a text file
    ifstream ifs("points.txt");
    int x, y;
    while(ifs >> x >> y)
    {
        points.push_back(Point2f(x,y));
    }

    // Insert points into subdiv
    for( vector<Point2f>::iterator it = points.begin(); it != points.end(); it++)
    {
        subdiv.insert(*it);
        // Show animation
        if (animate)
        {
            Mat img_copy = img_orig.clone();
            // Draw delaunay triangles
            draw_delaunay( img_copy, subdiv, delaunay_color );
            imshow(win_delaunay, img_copy);
            waitKey(100);
        }

    }

    // Draw delaunay triangles
    draw_delaunay( img, subdiv, delaunay_color );

    // Draw points
    for( vector<Point2f>::iterator it = points.begin(); it != points.end(); it++)
    {
        draw_point(img, *it, points_color);
    }

    // Allocate space for Voronoi Diagram
    Mat img_voronoi = Mat::zeros(img.rows, img.cols, CV_8UC3);

    // Draw Voronoi diagram
    draw_voronoi( img_voronoi, subdiv );

    // Show results.
    imshow( win_delaunay, img);
    imshow( win_voronoi, img_voronoi);
    waitKey(0);

    return 0;
}
Python Example
#!/usr/bin/python

import cv2
import numpy as np
import random

# Check if a point is inside a rectangle
def rect_contains(rect, point) :
    if point[0] < rect[0] :
        return False
    elif point[1] < rect[1] :
        return False
    elif point[0] > rect[2] :
        return False
    elif point[1] > rect[3] :
        return False
    return True

# Draw a point
def draw_point(img, p, color ) :
    cv2.circle( img, p, 2, color, cv2.cv.CV_FILLED, cv2.CV_AA, 0 )


# Draw delaunay triangles
def draw_delaunay(img, subdiv, delaunay_color ) :

    triangleList = subdiv.getTriangleList();
    size = img.shape
    r = (0, 0, size[1], size[0])

    for t in triangleList :

        pt1 = (t[0], t[1])
        pt2 = (t[2], t[3])
        pt3 = (t[4], t[5])

        if rect_contains(r, pt1) and rect_contains(r, pt2) and rect_contains(r, pt3) :

            cv2.line(img, pt1, pt2, delaunay_color, 1, cv2.CV_AA, 0)
            cv2.line(img, pt2, pt3, delaunay_color, 1, cv2.CV_AA, 0)
            cv2.line(img, pt3, pt1, delaunay_color, 1, cv2.CV_AA, 0)


# Draw voronoi diagram
def draw_voronoi(img, subdiv) :

    ( facets, centers) = subdiv.getVoronoiFacetList([])

    for i in xrange(0,len(facets)) :
        ifacet_arr = []
        for f in facets[i] :
            ifacet_arr.append(f)

        ifacet = np.array(ifacet_arr, np.int)
        color = (random.randint(0, 255), random.randint(0, 255), random.randint(0, 255))

        cv2.fillConvexPoly(img, ifacet, color, cv2.CV_AA, 0);
        ifacets = np.array([ifacet])
        cv2.polylines(img, ifacets, True, (0, 0, 0), 1, cv2.CV_AA, 0)
        cv2.circle(img, (centers[i][0], centers[i][1]), 3, (0, 0, 0), cv2.cv.CV_FILLED, cv2.CV_AA, 0)


if __name__ == '__main__':

    # Define window names
    win_delaunay = "Delaunay Triangulation"
    win_voronoi = "Voronoi Diagram"

    # Turn on animation while drawing triangles
    animate = True

    # Define colors for drawing.
    delaunay_color = (255,255,255)
    points_color = (0, 0, 255)

    # Read in the image.
    img = cv2.imread("image.jpg");

    # Keep a copy around
    img_orig = img.copy();

    # Rectangle to be used with Subdiv2D
    size = img.shape
    rect = (0, 0, size[1], size[0])

    # Create an instance of Subdiv2D
    subdiv = cv2.Subdiv2D(rect);

    # Create an array of points.
    points = [];

    # Read in the points from a text file
    with open("points.txt") as file :
        for line in file :
            x, y = line.split()
            points.append((int(x), int(y)))

    # Insert points into subdiv
    for p in points :
        subdiv.insert(p)

        # Show animation
        if animate :
            img_copy = img_orig.copy()
            # Draw delaunay triangles
            draw_delaunay( img_copy, subdiv, (255, 255, 255) );
            cv2.imshow(win_delaunay, img_copy)
            cv2.waitKey(100)

    # Draw delaunay triangles
    draw_delaunay( img, subdiv, (255, 255, 255) );

    # Draw points
    for p in points :
        draw_point(img, p, (0,0,255))

    # Allocate space for Voronoi Diagram
    img_voronoi = np.zeros(img.shape, dtype = img.dtype)

    # Draw Voronoi diagram
    draw_voronoi(img_voronoi,subdiv)

    # Show results
    cv2.imshow(win_delaunay,img)
    cv2.imshow(win_voronoi,img_voronoi)
    cv2.waitKey(0)
Subscribe & Download Code
If you liked this article and would like to download code and example images used in this post, please subscribe to our newsletter. You will also receive a free Computer Vision Resource guide. In our newsletter we share OpenCV tutorials and examples written in C++/Python, and Computer Vision and Machine Learning algorithms and news.
Image Credits
- The image of President Obama was is licensed under CC By 3.0 [ link ]
- The images used in Figure 2. are two frames of a gif licensed under CC By-SA 3.0 [ link ]
- The image in Figure 3. is licensed under CC BY-SA 4.0 [ link ]
FILED UNDER: FACE, HOW-TO TAGGED WITH: DELAUNAY, TESSELATION, TRIANGULATION, VORONOI