在之前的文章“使用Heartbeat进行Uptime监控”中,我介绍了使用 Uptime 来监控一个网站的运行情况。在之后的很多文章中我也介绍了如何使用 Elastic Alerts 来发送一个警报。如果你想了解更多,请参阅文章“Elastic: 创建一个 Elastic 邮件警报 - 7.7 发行版”。在今天的教程中,我将会把这两个用例串起来。使用 Elastic Stack 所提供的 Heartbeat 来监控一个网站的运行。当网站宕机的时候,它将自动发送一个警报到 Slack。

安装
Elasticsearch
我们可参考我之前的文章“如何在Linux,MacOS及Windows上进行安装Elasticsearch”来安装我们的Elasticsearch。我们可以不需要修改任何的配置文件,并在本机上运行。
Kibana
我们可以参考我之前的文章“如何在Linux,MacOS及Windows上安装Elastic栈中的Kibana”来进行我们的安装。
为了能够实现对网站的的监控,我们必须使用 Start a 30-day trial 授权以便对 Slack 发送通知:


例子网站
我们可以找到任何一个我们喜欢的网站进行监视。为了方便,我们使用一个最为简单的 nodejs 的网站:
git clone https://github.com/liu-xiao-guo/samplenodejs我们使用上面的命令进行下载,并使用如下的命令进行运行:
cd samplenodejs
npm install
npm start
如果顺利的话,我们可以在浏览器中输入地址 localhost:3000 地址:

如果我们能够看到上面的输出,则表明我们的 nodejs 的网站已经成功地运行起来。接下来,我们将使用 heartbeat 来监视这个网站的运行情况。
创建 Slack 账号
我们首先需要创建一个自己的Slack账号,并具有自己的管理员权限:

你可以参考链接 “Configuring Slack Account”来配置自己的Slack账号,并生成一个相应的一个Webhook URL。这个URL将会在Elasticsearch里进行使用。

在上面我们可以搜索 webhook:

点击上面的 Add:

点击 Add to Slack:

选择一个喜欢的 channel:

点击 Add Incoming Webhooks integration:

我们先把上面创建的webhook url记下来供下面的配置使用。
Heartbeat
运行我们的 Elasticsearch 及 Kibana。打开 Kibana 界面:

点击上面的 Configure Heartbeat 链接:

根据自己电脑的平台,我们选择相应的指令来进行安装 Heartbeat 并进行相应的配置。如果你想了解更多,请参阅我之前的文章“使用Heartbeat进行Uptime监控”。
根据我的情况,我选择 MacOS 来进行:
curl -L -O https://artifacts.elastic.co/downloads/beats/heartbeat/heartbeat-7.7.0-darwin-x86_64.tar.gz
tar xzvf heartbeat-7.7.0-darwin-x86_64.tar.gz
cd heartbeat-7.7.0-darwin-x86_64/
在heartbeat的目录中我们可以看到如下的文件:
$ pwd
/Users/liuxg/elastic7/heartbeat-7.7.0-darwin-x86_64
liuxg:heartbeat-7.7.0-darwin-x86_64 liuxg$ ls
LICENSE.txt             fields.yml              heartbeat.yml
NOTICE.txt              heartbeat               kibana
README.md               heartbeat.reference.yml monitors.d
在上面,我们可以看到 heartbeat.yml 文件。这个是我们的配置文件。我们接着需要对 Heartbeat 进行相应的配置:
output.elasticsearch:
  hosts: ["<es_url>"]
  username: "elastic"
  password: "<password>"
setup.kibana:
  host: "<kibana_url>"
在上面,我们对 Elasticsearch 及 Kibana 进行配置。我们把 Elasticsearch 及 Kibana 的地址写入到 heartbeat.yml 的配置文件中。如果你配置了安全,你需要把 usename 及 password 进行输入。
我们首先看到如下的部分:
heartbeat.config.monitors:
  # Directory + glob pattern to search for configuration files
  path: ${path.config}/monitors.d/*.yml
  # If enabled, heartbeat will periodically check the config.monitors path for changes
  reload.enabled: false
  # How often to check for changes
  reload.period: 5s
在上面,我们可以看到 path: ${path.config}/monitors.d/*.yml,它意味着在 heartbeat 安装的目录下的 monitors.d 文件目录下的所有yml 文件将作为配置文件进行网站或服务的监控。
我们把如下的部分:
heartbeat.monitors:
- type: http

  # List or urls to query
  urls: ["http://localhost:9200"]

  # Configure task schedule
  schedule: '@every 10s'

  # Total test connection and data exchange timeout
  #timeout: 16s
进行注释,因为我们想把监控的而部分移到 monitors.d 子目录下进行。这样这个部分变为:
heartbeat.monitors:
#- type: http

  # List or urls to query
  #urls: ["http://localhost:9200"]

  # Configure task schedule
  #schedule: '@every 10s'

  # Total test connection and data exchange timeout
  #timeout: 16s
我们保存好 heartbeat.yml 文件。然后,我们进入 monitors.d 文件目录:
$ cd monitors.d/
liuxg:monitors.d liuxg$ pwd
/Users/liuxg/elastic7/heartbeat-7.7.0-darwin-x86_64/monitors.d
liuxg:monitors.d liuxg$ ls
sample.http.yml.disabled sample.icmp.yml.disabled sample.tcp.yml.disabled
我们看见上面的几个例子的 yml 文件都是被 disabled。我们把上面的 sample.http.disabled 文件复制为 uptime.http.yml 文件:
cp sample.http.yml.disabled uptime.http.yml我们然后使用我们喜欢的编辑器来对这个文件进行编辑:
uptime.http.yml
# These files contain a list of monitor configurations identical
# to the heartbeat.monitors section in heartbeat.yml
# The .example extension on this file must be removed for it to
# be loaded.

- type: http # monitor type `http`. Connect via HTTP an optionally verify response

  # Monitor name used for job name and document type
  #name: http

  # Enable/Disable monitor
  #enabled: true

  # Configure task schedule
  schedule: '@every 10s' # every 5 seconds from start of beat

  # Configure URLs to ping
  hosts: ["http://localhost:3000"]

  # Configure IP protocol types to ping on if hostnames are configured.
  # Ping all resolvable IPs if `mode` is `all`, or only one IP if `mode` is `any`.
  ipv4: true
  ipv6: true
  mode: any

  # Optional HTTP proxy url.
  #proxy_url: ''

  # Total test connection and data exchange timeout
  #timeout: 16s

  # Optional Authentication Credentials
  #username: ''
  #password: ''

  # TLS/SSL connection settings for use with HTTPS endpoint. If not configured
  # system defaults will be used.
  #ssl:
  # Certificate Authorities
  #certificate_authorities: ['']

  # Required TLS protocols
  #supported_protocols: ["TLSv1.0", "TLSv1.1", "TLSv1.2"]

  # Request settings:
  #check.request:
  # Configure HTTP method to use. Only 'HEAD', 'GET' and 'POST' methods are allowed.
  method: "GET"

  # Dictionary of additional HTTP headers to send:
  #headers:

  # Optional request body content
  #body:

  # Expected response settings
  check.response:
    # Expected status code. If not configured or set to 0 any status code not
    # being 404 is accepted.
    status: 200

    # Required response headers.
    #headers:

    # Required response contents.
    #body:

    # Parses the body as JSON, then checks against the given condition expression
    #json:
    #- description: Explanation of what the check does
    #  condition:
    #    equals:
    #      myField: expectedValue

  # The tags of the monitors are included in their own field with each
  # transaction published. Tags make it easy to group servers by different
  # logical properties.
  #tags: ["service-X", "web-tier"]

  # Optional fields that you can specify to add additional information to the
  # monitor output. Fields can be scalar values, arrays, dictionaries, or any nested
  # combination of these.
  #fields:
  #  env: staging

  # If this option is set to true, the custom fields are stored as top-level
  # fields in the output document instead of being grouped under a fields
  # sub-dictionary. Default is false.
  #fields_under_root: false
在上面,我们使用 HTTP GET 来检查返回的 response 代码是否为 200 作为一个判断标准。如果是 200,则表示网站运行正常。我们可以通过如下的 curl 指令来获得这个 response 代码:
$ curl -I localhost:3000
HTTP/1.1 200 OK
X-Powered-By: Express
Content-Type: text/html; charset=utf-8
Content-Length: 170
ETag: W/"aa-z+ebXSEdArbZ+EXlN/WQjf6HV8c"
Date: Sun, 24 May 2020 12:33:55 GMT
Connection: keep-alive
我们可以使用如下的指令来检查我们的配置是否成功:
./heartbeat test config -e接下来按照 Kibana 中的命令,我需要在 heartbeat 安装目录下执行如下的命令:
./heartbeat setup
./heartbeat -e
$ ./heartbeat setup
Overwriting ILM policy is disabled. Set `setup.ilm.overwrite:true` for enabling.
Index setup finished.我们接下来运行 heartbeat:
./heartbeat -e
我们打开 Kibana:

上面显示我们的网站 localhost:3000 的运行情况。目前显示是正常运行的。没有任何的错。在 samplenodjs 的 console 中我们可以看到如下的输出:

在这个时候如果我们停止运行 samplenodejs 应用,那么我可以看到:

显然在上面显示了网站的运行情况。网站目前是 Down 的状态,表明我们的网站已经挂了。在接下来的练习中,我们将使用 Elastic 7.7 版本中所提供的功能来进行警报通知。为了下面的测试,我们重新运行起来我们的 nodejs 网站。
发送 Slack 警报
在这节里,我们将介绍如何使用 Elastic 提供的警报功能发送一个警报。打开 Kibaba:

点击 Create alert:

点击 Slack:

点击 Create a connector:

点击上面的 Save 按钮:

点击上面的 Save 按钮:

这样我们就创建了我们的 Uptime Alert。我们可以到 Alerts and Actions 里进行查看:

上面显示我们的 nodejs_monitor 已经被创建好了。接下来,我们开始来做测试。我们把 samplenodejs 应用关掉。然后,我们也在 Kibanan 中的 Uptime 中可以看到:

这个时候,在我们的 Slack 中可以看到如下的信息:

它显示我们的 Uptime 应用已经发送网站挂掉的消息。这说明我们的警报是成功的。我们稍等一会,我们会看到更多的信息:

这是因为在过去15分钟内有5次及以上的 Down 信息,它就会一直发送这个通知信息。如果这个时候,我们再把 nodejs 的应用运行起来。我们待会就看不到这个通知信息了。
上面我们展示了使用 heartbeat 监视一个网站的运行,如果我们想监视更多的网站的运行,那么我们可以修改 uptime.http.yml 文件:
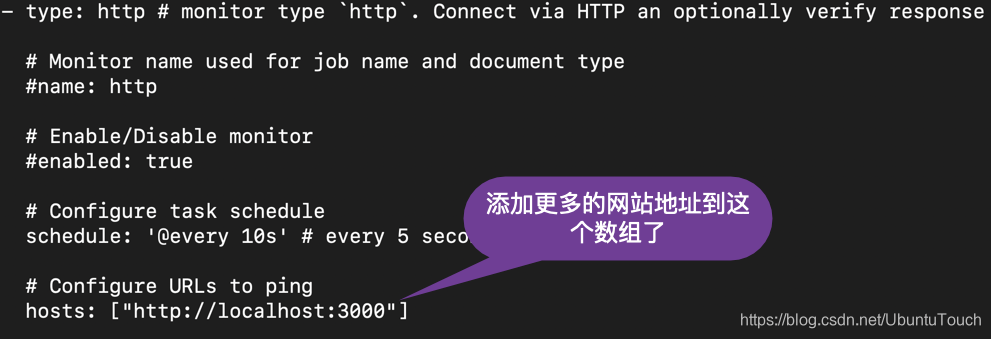
如上所示,上面的 hosts 是一个数值。我们可以添加更多的网站地址到这个数组中,从而使得我们的监控可以多达数个网站。