使用gdb调试,可以发现一些我们理解错误的逻辑问题,一般情况下我都是使用gdb进行调试的。
但有时我们的应用程序很大,我们不知道哪里出的问题,即gdb调试不知道在哪里打断点(当然也可以单步或者自己定几个断点),这个时候就需要有别的方法来找到出错的大概位置。
假设我们在程序中,对为初始化的指针赋值。或者对已经释放的内存进行了使用,很容易导致段错误。
这里我以一个简单的例子为例来说明。
#include <stdio.h>
#include <sys/types.h>
#include <sys/stat.h>
#include <fcntl.h>
#include <unistd.h>
#include <string.h>
#include <stdlib.h>
void func(int *p )
{
*p = 666;
}
int main(void)
{
int *p = NULL;
int val = 333;
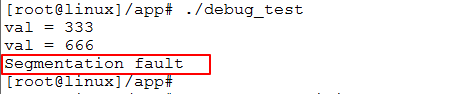
printf("val = %d \n",val);
func(&val);
printf("val = %d \n",val);
/*
* 对NULL地址赋值
*/
func(p);
printf("val = %d \n",*p);
return 0;
}
正常情况下,应用程序访问了非法地址,就会导致段错误。
但我们不知道是程序中那里出现的错误,所以这个定位很重要。
但我们想知道更多的错误信息来更好的定位错误位置。
比如在内核情况下发生错误会打印出寄存器,栈信息等
[root@linux]/# insmod drivers/simple_usb.ko
simple_usb: loading out-of-tree module taints kernel.
usbcore: registered new interface driver usb_simple
[root@linux]/# usb 1-1.4: new low-speed USB device number 3 using exynos-ehci
usb 1-1.4: New USB device found, idVendor=2188, idProduct=0ae1, bcdDevice= 1.00
usb 1-1.4: New USB device strings: Mfr=0, Product=1, SerialNumber=0
usb 1-1.4: Product:  USB OPTICAL MOUSE
usb_simple_probe
bcdUSB  = 0x110
VID     = 0x2188
PID     = 0xae1
Unable to handle kernel NULL pointer dereference at virtual address 00000000
pgd = ed300654
[00000000] *pgd=00000000
Internal error: Oops: 817 [#1] PREEMPT ARM
Modules linked in: simple_usb(O)
CPU: 0 PID: 1147 Comm: kworker/0:2 Tainted: G           O      4.19.0-ga2a89a6-dirty #16
Hardware name: Samsung S5PC110/S5PV210-based board
Workqueue: usb_hub_wq hub_event
PC is at usb_simple_probe+0x54/0x5c [simple_usb]
LR is at usb_simple_probe+0x50/0x5c [simple_usb]
pc : [<7f000060>]    lr : [<7f00005c>]    psr: 60000013
sp : 9ecc5c00  ip : 60000013  fp : ffffffed
r10: 7f001020  r9 : 00000000  r8 : 9f46c200
r7 : 7f002040  r6 : 9ef81c00  r5 : 9ef81c78  r4 : 9ef81c78
r3 : 00000000  r2 : 00000000  r1 : 9ecc5ba0  r0 : 00000000

.........
我们就像在用户空间程序出错也打印这些信息。
第一步先找到内核空间,错误是在那里打印的。
搜索"Unable to handle kerne"这个字符串就可以。
可以发现是在下面这个文件中找到的
arch/arm/mm/fault.c
/*
 * Oops.  The kernel tried to access some page that wasn't present.
 */
static void
__do_kernel_fault(struct mm_struct *mm, unsigned long addr, unsigned int fsr,
		  struct pt_regs *regs)
{
	/*
	 * Are we prepared to handle this kernel fault?
	 */
	if (fixup_exception(regs))
		return;

	/*
	 * No handler, we'll have to terminate things with extreme prejudice.
	 */
	bust_spinlocks(1);
	pr_alert("Unable to handle kernel %s at virtual address %08lx\n",
		 (addr < PAGE_SIZE) ? "NULL pointer dereference" :
		 "paging request", addr);

	show_pte(mm, addr);
	die("Oops", regs, fsr);
	bust_spinlocks(0);
	do_exit(SIGKILL);
}
这个是内核出错打印的信息。
我们向上搜索一下,它的调用函数这里有,在用户空间出错的处理,调用__do_user_fault函数
void do_bad_area(unsigned long addr, unsigned int fsr, struct pt_regs *regs)
{
	struct task_struct *tsk = current;
	struct mm_struct *mm = tsk->active_mm;

	/*
	 * If we are in kernel mode at this point, we
	 * have no context to handle this fault with.
	 */
	if (user_mode(regs))
		__do_user_fault(tsk, addr, fsr, SIGSEGV, SEGV_MAPERR, regs);
	else
		__do_kernel_fault(mm, addr, fsr, regs);
}
可以看一下这函数
/*
 * Something tried to access memory that isn't in our memory map..
 * User mode accesses just cause a SIGSEGV
 */
static void
__do_user_fault(struct task_struct *tsk, unsigned long addr,
		unsigned int fsr, unsigned int sig, int code,
		struct pt_regs *regs)
{
	struct siginfo si;

	if (addr > TASK_SIZE)
		harden_branch_predictor();

	clear_siginfo(&si);

#ifdef CONFIG_DEBUG_USER
	if (((user_debug & UDBG_SEGV) && (sig == SIGSEGV)) ||
	    ((user_debug & UDBG_BUS)  && (sig == SIGBUS))) {
		printk(KERN_DEBUG "%s: unhandled page fault (%d) at 0x%08lx, code 0x%03x\n",
		       tsk->comm, sig, addr, fsr);
		show_pte(tsk->mm, addr);
		show_regs(regs);
	}
#endif

	tsk->thread.address = addr;
	tsk->thread.error_code = fsr;
	tsk->thread.trap_no = 14;
	si.si_signo = sig;
	si.si_errno = 0;
	si.si_code = code;
	si.si_addr = (void __user *)addr;
	force_sig_info(sig, &si, tsk);
}
是可以打印一些寄存器信息的,但要在这个CONFIG_DEBUG_USER打开,且user_debug变量有效的情况下。
搜索这个配置文件,并配置为 y


第一个点解决,现在看第二个
#define UDBG_UNDEFINED	(1 << 0)
#define UDBG_SYSCALL	(1 << 1)
#define UDBG_BADABORT	(1 << 2)
#define UDBG_SEGV	(1 << 3)
#define UDBG_BUS	(1 << 4)


#ifdef CONFIG_DEBUG_USER
	if (((user_debug & UDBG_SEGV) && (sig == SIGSEGV)) ||
	    ((user_debug & UDBG_BUS)  && (sig == SIGBUS))) {
		printk(KERN_DEBUG "%s: unhandled page fault (%d) at 0x%08lx, code 0x%03x\n",
		       tsk->comm, sig, addr, fsr);
		show_pte(tsk->mm, addr);
		show_regs(regs);
	}
#endif
user_debug 变量要满足这几个bit为1
但因为这个变量user_debug 初始值为0,传参只能通过,命令行使用user_debug=xx来传参,所以我们的设备树中的bootargs需要修改。
#ifdef CONFIG_DEBUG_USER
unsigned int user_debug;

static int __init user_debug_setup(char *str)
{
	get_option(&str, &user_debug);
	return 1;
}
__setup("user_debug=", user_debug_setup);
#endif
因为这个参数只使用了5个bit,所以我们把这个五个bit都给成1.

再次重启,可以看到打印出了应用程序的PID以及寄存器值。

这里我们根据PC值来找出出错位置。
PC=0x8530
反汇编可执行文件。
这里列出我们应用程序相关的部分:
......

00008518 <func>:
    8518:       e52db004        push    {fp}            ; (str fp, [sp, #-4]!)
    851c:       e28db000        add     fp, sp, #0
    8520:       e24dd00c        sub     sp, sp, #12
    8524:       e50b0008        str     r0, [fp, #-8]
    8528:       e51b3008        ldr     r3, [fp, #-8]
    852c:       e59f200c        ldr     r2, [pc, #12]   ; 8540 <func+0x28>
    8530:       e5832000        str     r2, [r3]
    8534:       e24bd000        sub     sp, fp, #0
    8538:       e49db004        pop     {fp}            ; (ldr fp, [sp], #4)
    853c:       e12fff1e        bx      lr
    8540:       0000029a        muleq   r0, sl, r2

0008544 <main>:
    8544:       e92d4800        push    {fp, lr}
    8548:       e28db004        add     fp, sp, #4
    854c:       e24dd008        sub     sp, sp, #8
    8550:       e3a03000        mov     r3, #0
    8554:       e50b3008        str     r3, [fp, #-8]
    8558:       e59f3058        ldr     r3, [pc, #88]   ; 85b8 <main+0x74>
    855c:       e50b300c        str     r3, [fp, #-12]
    8560:       e51b300c        ldr     r3, [fp, #-12]
    8564:       e59f0050        ldr     r0, [pc, #80]   ; 85bc <main+0x78>
    8568:       e1a01003        mov     r1, r3
    856c:       ebffff90        bl      83b4 <_init+0x20>
    8570:       e24b300c        sub     r3, fp, #12
    8574:       e1a00003        mov     r0, r3
    8578:       ebffffe6        bl      8518 <func>
    857c:       e51b300c        ldr     r3, [fp, #-12]
    8580:       e59f0034        ldr     r0, [pc, #52]   ; 85bc <main+0x78>
    8584:       e1a01003        mov     r1, r3
    8588:       ebffff89        bl      83b4 <_init+0x20>
    858c:       e51b0008        ldr     r0, [fp, #-8]
    8590:       ebffffe0        bl      8518 <func>
    8594:       e51b3008        ldr     r3, [fp, #-8]
    8598:       e5933000        ldr     r3, [r3]
    859c:       e59f0018        ldr     r0, [pc, #24]   ; 85bc <main+0x78>
    85a0:       e1a01003        mov     r1, r3
    85a4:       ebffff82        bl      83b4 <_init+0x20>
    85a8:       e3a03000        mov     r3, #0
    85ac:       e1a00003        mov     r0, r3
    85b0:       e24bd004        sub     sp, fp, #4
    85b4:       e8bd8800        pop     {fp, pc}
    85b8:       0000014d        andeq   r0, r0, sp, asr #2
    85bc:       00008634        andeq   r8, r0, r4, lsr r6

......
可以看到0x8530地址

可以看到这是一个r2给r3寄存器的写操作。
我们找到大概位置之后,无论是继续通过汇编反推,话是用gdb在这个位置附近调试,都可以很快定位问题。
这里我们看一下我的gdb调试信息
[root@linux]/app# gdb debug_test
GNU gdb (GDB) 8.2.1
Copyright (C) 2018 Free Software Foundation, Inc.
License GPLv3+: GNU GPL version 3 or later <http://gnu.org/licenses/gpl.html>
This is free software: you are free to change and redistribute it.
There is NO WARRANTY, to the extent permitted by law.
Type "show copying" and "show warranty" for details.
This GDB was configured as "arm-none-linux-gnueabi".
Type "show configuration" for configuration details.
For bug reporting instructions, please see:
<http://www.gnu.org/software/gdb/bugs/>.
Find the GDB manual and other documentation resources online at:
<http://www.gnu.org/software/gdb/documentation/>.
For help, type "help".
Type "apropos word" to search for commands related to "word"...
Reading symbols from debug_test...done.
(gdb) l
4 #include <fcntl.h>
5 #include <unistd.h>
6 #include <string.h>
7 #include <stdlib.h>
8
9
10 void func(int *p )
11 {
12 *p = 666;
13 }
(gdb) l mi ai^CQuit
(gdb) l main
12 *p = 666;
13 }
14
15
16 int main(void)
17 {
18 int *p = NULL;
19 int val = 333;
20
21 printf("val = %d \n",val);
(gdb) start
Temporary breakpoint 1 at 0x8550: file debug_test.c, line 18.
Starting program: /app/debug_test
Temporary breakpoint 1, main () at debug_test.c:18
18 int *p = NULL;
(gdb) s
19 int val = 333;
(gdb) s
21 printf("val = %d \n",val);
(gdb) l 21 ^CQuit
(gdb) l 16 ^CQuit
(gdb) l 21
16 int main(void)
17 {
18 int *p = NULL;
19 int val = 333;
20
21 printf("val = %d \n",val);
22 func(&val);
23 printf("val = %d \n",val);
24 func(p);
25 printf("val = %d \n",*p);
(gdb) s
val = 333
22 func(&val);
(gdb) s
func (p=0x7efffcf8) at debug_test.c:12
12 *p = 666;
(gdb) p p
$1 = (int *) 0x7efffcf8
(gdb) s
13 }
(gdb) s
main () at debug_test.c:23
23 printf("val = %d \n",val);
(gdb) s
val = 666
24 func(p);
(gdb) s
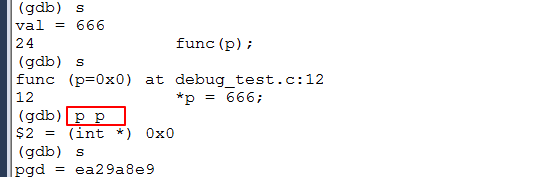
func (p=0x0) at debug_test.c:12
12 *p = 666;
(gdb) p p
$2 = (int *) 0x0
(gdb) s
pgd = ea29a8e9
[00000000] *pgd=4ef6e831, *pte=00000000, *ppte=00000000
CPU: 0 PID: 1223 Comm: debug_test Not tainted 4.19.0-ga2a89a6-dirty #20
Hardware name: Samsung S5PC110/S5PV210-based board
PC is at 0x8530
LR is at 0x8594
pc : [<00008530>] lr : [<00008594>] psr: 60000010
sp : 7efffce8 ip : 00000000 fp : 7efffcf4
r10: 76fff000 r9 : 00000000 r8 : 00000000
r7 : 00000000 r6 : 000083e4 r5 : 00000000 r4 : 00000000
r3 : 00000000 r2 : 0000029a r1 : 00000000 r0 : 00000000
Flags: nZCv IRQs on FIQs on Mode USER_32 ISA ARM Segment user
Control: 10c5387d Table: 4ef40019 DAC: 00000055
CPU: 0 PID: 1223 Comm: debug_test Not tainted 4.19.0-ga2a89a6-dirty #20
Hardware name: Samsung S5PC110/S5PV210-based board
[<8010db00>] (unwind_backtrace) from [<8010b644>] (show_stack+0x10/0x14)
[<8010b644>] (show_stack) from [<8010e410>] (__do_user_fault+0xe4/0xe8)
[<8010e410>] (__do_user_fault) from [<8010e5ac>] (do_page_fault+0x198/0x2a0)
[<8010e5ac>] (do_page_fault) from [<8010e820>] (do_DataAbort+0x38/0xc0)
[<8010e820>] (do_DataAbort) from [<80101d9c>] (__dabt_usr+0x3c/0x40)
Exception stack(0x9ef1bfb0 to 0x9ef1bff8)
bfa0: 00000000 00000000 0000029a 00000000
bfc0: 00000000 00000000 000083e4 00000000 00000000 00000000 76fff000 7efffcf4
bfe0: 00000000 7efffce8 00008594 00008530 60000010 ffffffff
Program received signal SIGSEGV, Segmentation fault.
0x00008530 in func (p=0x0) at debug_test.c:12
12 *p = 666;
(gdb) s
Program terminated with signal SIGSEGV, Segmentation fault.
(gdb) q
[root@linux]/app#
我基本上就用了三五个gdb的命令
- start:开始运行
- l :打印代码,可以后面跟行号,也可根函数名称
- s:单步调试
- p:打印变量值
比如我上面的 p p 表示打印参数 p 的值
为了更形象的表示,我再举个例子,打印val的值。打印p的值,可以看到gdb打印的p表示为是一个指针

有了基本的定位之后,我们再使用gdb调试会方便很多。