
基本流程:
1)Logstash-Shipper获取日志信息发送到redis。
2)Redis在此处的作用是防止ElasticSearch服务异常导致丢失日志,提供消息队列的作用。[注意,测试时如果写到redis里的日志量比较小,则很快就会被输送到elasticsearch,输送完之后,届时在redis里的key就没有了,也就查看不到了.]
3)logstash是读取Redis中的日志信息发送给ElasticSearch。
4)ElasticSearch提供日志存储和检索。
5)Kibana是ElasticSearch可视化界面插件。
1 Redis设置密码
#redis-cli  -h 192.168.1.230 -p 6379
>config set requirepass 123456
>auth 123456
>config get requirepass
说明:redis必须设置密码,否则启动filebeat报错

2.修改filebaet配置文件
#cat /etc/filebeat/filebeat.yml
filebeat.inputs:
- type: log
  enabled: true
  paths:
    - /var/log/*.log
    - /var/log/messages
  tags: ["system-log-5611"]
  exclude_lines: ['^DBG','^$']
filebeat.config.modules:
  path: ${path.config}/modules.d/*.yml
  reload.enabled: true
setup.template.settings:
  index.number_of_shards: 1
output.redis:
  hosts: ["192.168.1.226:6379"]
  db: "0"
  password: "123456"
  key: "system-log-5611"

#重启filebeat
#systemctl restart filebeat

#查看redis中生产的key

3 配置使用logstash取出redis里面的数据
# cd /etc/logstash/conf.d
# cat logstash‐simple.conf
input{
    redis {
    host => "192.168.1.226"
    port => "6379"
    password => "123456"
    db => "0"
    data_type => "list"
    key => "system-log-5611"

}
}

output{
    if "system-log-5611" in [tags]  {
       elasticsearch {
            hosts => ["192.168.1.224:9200"]
            index => "system-log-5611-%{+YYYY.MM.dd}"
        }
       stdout{
           codec => rubydebug
       }
    }
}

#测试配置文件
#/usr/share/logstash/bin/logstash --path.settings /etc/logstash/ -f /etc/logstash/conf.d/logstash‐simple.conf --config.test_and_exit
Config Validation Result: OK  #代表配置文件没有问题

#将日志输出到当前的终端上显示
#/usr/share/logstash/bin/logstash --path.settings /etc/logstash/ -f /etc/logstash/conf.d/logstash‐simple.conf
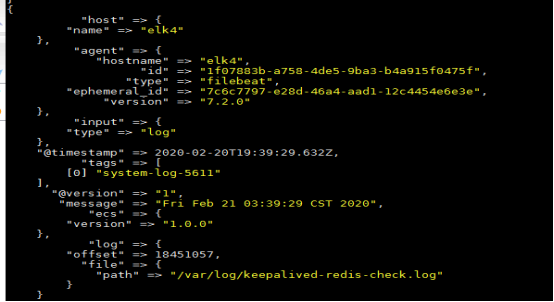
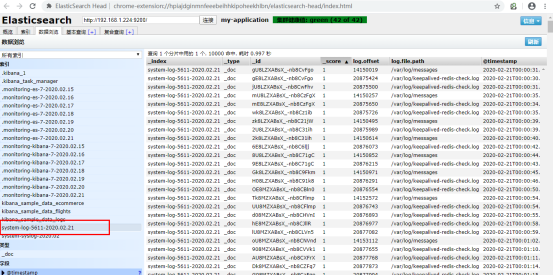
同时elasticsearch也收到索引信息
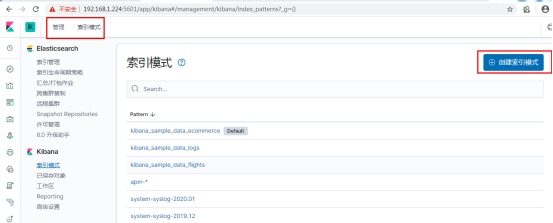
5.添加到kibana展示
创建索引模式,创建好之后,在Discover中展示

参考链接: