By combining the massively popular Elasticsearch, Logstash, and Kibana (what was the ELK Stack is now the Elastic Stack), Elastic has created an end-to-end stack that delivers actionable insights in real time from almost any type of structured and unstructured data source.
Built and supported by the engineers behind each of these open source products, the Elastic Stack makes searching and analyzing data easier than ever before. Thousands of organizations worldwide use these products for an endless variety of business critical functions.
In this article, you will be treated to:
- An overview of the key features of Elasticsearch, Logstash & Kibana
- Adeeperdiveonhowtheirpowers combine to deliver an end to end solution for analytics, logging, search & visualization
- A demo of the Elastic Stack in action
Component
Elasticsearch
Elasticsearch is a distributed, RESTful search and analytics engine capable of solving a growing number of use cases. As the heart of the Elastic Stack, it centrally stores your data so you can discover the expected and uncover the unexpected.
Elasticsearch VS Relational Database
| Elasticsearch |
Relational DB |
|---|---|
| Index | Database |
| Type | Table |
| Document | Row |
| Filed | Column |
| Mapping | Schema |
| Everything is indexed | Index |
| Query DSL | SQL |
| GEThttp:// | SELECT * FROM table |
| PUThttp:// | UPDATE table SET |
Meanings of ES Restful API GET, POST, PUT, DELETE, HEAD:
1) GET: get the current status of the requested object
2) POST: change the current status of the requested object
3) PUT: create an object
4) DELETE: delete an object
5) HEAD: get the basic information of the object.
Logstash
Logstash is an open source, server-side data processing pipeline that ingests data from a multitude of sources simultaneously, transforms it, and then sends it to your favorite “stash.” (Ours is Elasticsearch, naturally.)
Logstashconsiststhree parts: inputs, filters andoutputs.
Inputs - Ingest Data of All Shapes, Sizes, and Sources
Data is often scattered or siloed across many systems in many formats. Logstash supports a variety of inputs that pull in events from a multitude of common sources, all at the same time. Easily ingest from your logs, metrics, web applications, data stores, and various AWS services, all in continuous, streaming fashion.
Filters - Parse & Transform Your Data On the Fly
As data travels from source to store, Logstash filters parse each event, identify named fields to build the structure, and transform them to converge on a common format for easier, accelerated analysis and business value.
Logstash dynamically transforms and prepare your data regardless of format or complexity:
- Derive structure from unstructured data with grok
- DeciphergeocoordinatesfromIP addresses
- Anonymize PII data, exclude sensitive fields completely
- Ease overall processing independent of the data source, format, or schema.
For example, it turns:

into this:

Outputs - Choose Your Stash, Transport Your Data
While Elasticsearch is our go-to output that opens up a world of search and analytics possibilities, it’s not the only one available.
Logstash has a variety of outputs that let you route data where you want, giving you the flexibility to unlock a slew of downstream use cases.
Kibana
Kibana lets you visualize your Elasticsearch data and navigate the Elastic Stack.
Kibana developer tools offer powerful ways to help developers interact with the Elastic Stack. With Console, you can bypass using curl from the terminal and tinker with your Elasticsearch data directly. The Search Profiler lets you easily see where time is spent during search requests. And authoring complex grok patterns in your Logstash configuration becomes a breeze with the Grok Debugger.
Setup ELK Cluster
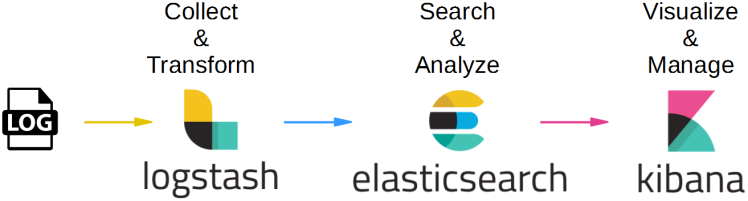
The following graph shows a completed chain of data processing from collecting data to visualize/manage data.
Here we will introduce how to setup elastic search cluster.
- Download Logstash, Elasticsearch and Kibana from https://www.elastic.co/downloads and unzip the installation package.
- Set JAVA environment variable for Logstash and Elasticsearch.
Add the following statement in file: logstash-5.6.0/bin/logstash and /elasticsearch-6.0.0/bin/elasticsearch
export JAVA_HOME='/scratch/software/java/jdk1.8.0_141' //your jdk home -
The default network host for Elasticsearch is localhost<192.168.0.1>. If you want to visit it externally, you must change network.host by adding the following statement in /elasticsearch-6.0.0/config/elasticsearch.yml
discovery.type: single-node
network.host: <hostname>
Elasticsearch will by default assume you enter a production mode if you allow external access. If you did not explicitly set the discovery type as singlenode, it will consistenlythrowerror: max file descriptors [4096] for elasticsearch process is too low, increase to at least [65536] when start elasticsearch.
If you cannot start Elasticsearch because of the following errors:
bootstrap checks failed:
max number of threads [1024] for user [mengxu] is too low, increase to at least [2048]
max virtual memory areas vm.max_map_count [65530] is too low, increase to at least [262144]
Execute the following commands to solve the errors accordingly.
limit maxproc 2048
sudo /sbin/sysctl -w vm.max_map_count=262144
By default ES only allows local machine to access, so here we need to change network.host to allow remote access.
If network.host is set to 0.0.0.0 then everyone can access it. But it is not recommended.
-
Start Elasticsearch by ./bin/elasticsearch. Once Elasticsearch starts successfully, you can visit http://<hostname>:9200/ and see:

-
Writethefirstlogstashconfigurefile. Create a new file underLogstashfolder, say, first-pipeline.conf. In this file, we will configure two important parts: input and output components.
In the following example, we set the input as results from SQL query results.
Latest index creation script: Index Creation - Logstash Conf Script
first-pipeline.conf Expand source
jdbc_connection_string : change to your DB.
jdbc_driver_library: location of ojdbc7.jar. You can download ojdbc7.jar from http://www.oracle.com/technetwork/database/features/jdbc/jdbc-drivers-12c-download-1958347.html if have none.
hosts: change to your host:9200
index: change to whatever index name you want
-
Start logstash by command: ./bin/logstash -f first-pipeline.conf.
Once Logstash is started successfully you can open http://<hostname>:9200/_search and find the log in JSON format.
By default, it only displays 10 records of the results. If you want to see more or fewer records, you can specify query condition "size" after the urllikehttp://<hostname>:9200/_search?size=20.

-
Similarly, add the following parameters in kibana-6.0.0-linux-x86_64/config/kibana.yml so that you can visualize kibana externally. The default port for kibana is 5601. (NOTE: server.host but not server.name)
server.host: <your host name>
elasticsearch.url: "http://<hostname>:9200"
- Start Kibana by ./bin/kibana. Once Kibana is started successfully, you can visit http://<hostname>:5601/app/kibana. You can use it to explore, visualize and discover data.

Issues and Solutions
| # |
Issue |
Solution |
|
|---|---|---|---|
| 1 | Unable to start Kibana: FATAL CLI ERROR YAMLException: end of the stream or a document separator is expected at line 22, column 1: |
Check kibana.yml: There should be space after : |
|
| 2 | Kibanastatus:red
|
Check whether the versions of Kibana and ES are the same | |
| 3 | Kibanastatus:red log [05:37:01.267] [error][status][plugin:[email protected]] Status changed from yellow to red - OSCS-0004 Missing service GUID header: x-resource-service-instance-guid
|
In kibana.yml, change elasticsearch.url in kibana.yml from elasticsearch.url: "http://<hostname>:8080" to: elasticsearch.url: "http://<hostname>:9200" |
|
| 4 | Unable to start logstash: Unable to find JRuby. If you are a user, this is a bug. If you are a developer, please run 'rake bootstrap'. Running 'rake' requires the 'ruby' program be available. |
Check if Logstash is completed. |
|
| 5 | [ERROR][logstash.outputs.elasticsearch] Encountered a retryable error. Will Retry with exponential backoff {:code=>400, :url=>"http://<hostname>:9200/_bulk"} |
In elasticsearch-6.1.2/config/elasticsearch.yml, we found
Change this parameter to true. Restart Elasticsearch using stop command and restart Logstash. |
|
| 6 | Error: Java::oracle.jdbc.driver.OracleDriver not loaded. Are you sure you've included the correctjdbcdriverin :jdbc_driver_library? | Check the ojdbc7.jar to see if it's available. | |
| 7 | [2018-08-01T01:28:27,775][FATAL][logstash.runner ] Logstash could not be started because there is already another instance using the configured data directory. If you wish to run multiple instances, you must change the "path.data" setting. |
This error occurs because you have anotherlogstashinstance starting, just terminate the instance and the issue is gone. | |
| 8 | |||
| 9 | |||
| 10 | |||
| 11 | |||
| 12 | |||
| 13 |


]