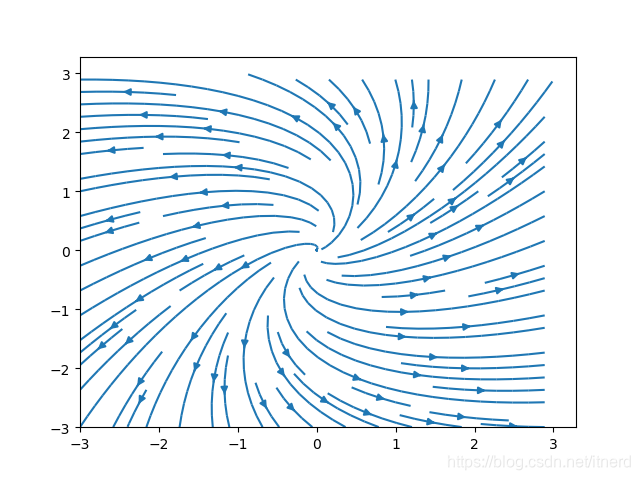
主要用到 pylab 里的 meshgrid,streamplot 函数
绘制如下系统的相图:
from pylab import meshgrid,  arange, streamplot, show

x, y = meshgrid(arange(-3, 3.1, 0.1), arange(-3, 3.1, 0.1))

vx = 2 * x- y
vy = y + x

streamplot(x, y, vx, vy)

show()
主要用到 pylab 里的 meshgrid,streamplot 函数
绘制如下系统的相图:
from pylab import meshgrid, arange, streamplot, show
x, y = meshgrid(arange(-3, 3.1, 0.1), arange(-3, 3.1, 0.1))
vx = 2 * x- y
vy = y + x
streamplot(x, y, vx, vy)
show()
