前期,我已经做完了Prometheus,Grafana
Prometheus和Grafana安装链接:https://blog.csdn.net/a13568hki/article/details/105504599
1、安装mysql_exporter
官方下载地址:https://prometheus.io/download/
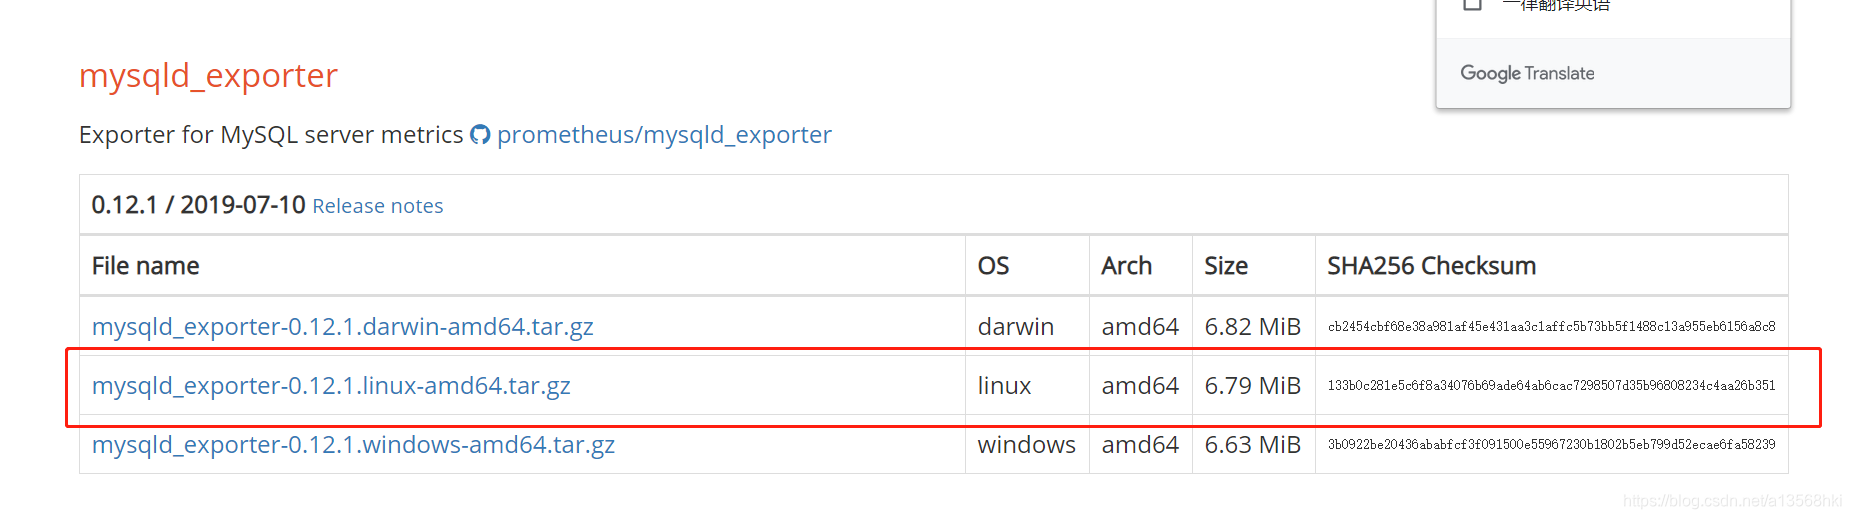
2、下载到被监控端解压压缩包并移动到指定目录
wget https://github.com/prometheus/mysqld_exporter/releases/download/v0.12.1/mysqld_exporter-0.12.1.linux-amd64.tar.gz
tar zxf mysqld_exporter-0.12.1.linux-amd64.tar.gz -C /usr/local/
cd /usr/local/mysqld_exporter-0.12.1.linux-amd64/
3、安装并登录mysql为exporter创建账号并授权
yum -y install mariadb mariadb-server
systemctl restart mariadb
创建数据库用户。
mysql> CREATE USER ‘exporter’@‘localhost’ IDENTIFIED BY ‘123456’;
可查看主从运行情况查看线程,及所有数据库。
mysql> GRANT PROCESS, REPLICATION CLIENT, SELECT ON . TO ‘exporter’@‘localhost’;
4、创建mysql配置文件、运行时可免密码连接数据库:vim /usr/local/mysqld_exporter-0.12.1.linux-amd64/.my.cnf
[client]
user=exporter
password=123456
5、启动exporter客户端
nohup ./mysqld_exporter --config.my-cnf=.my.cnf &
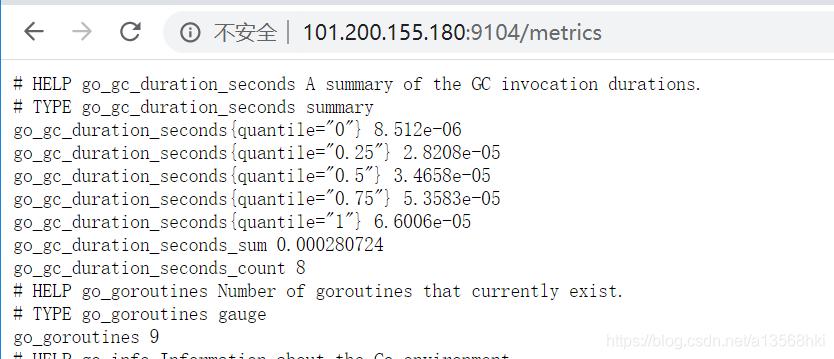
6、查看捕获mysql数据
http://101.200.155.180:9104
7、使用prometheus监控修改监控端配置文件:vim prometheus.yml
vim /usr/local/prometheus/prometheus.yml
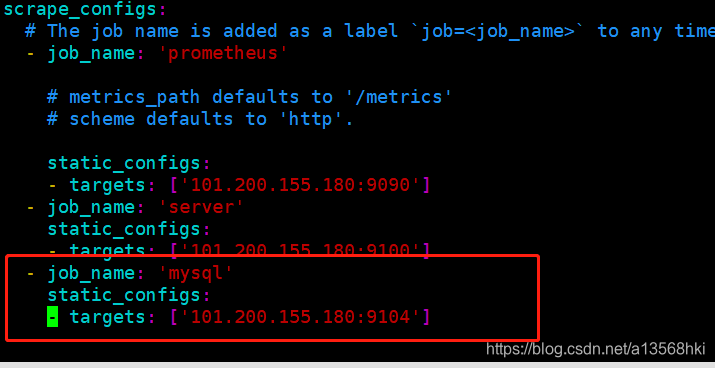
在重启Prometheus监控
8、查看监控端是否介入
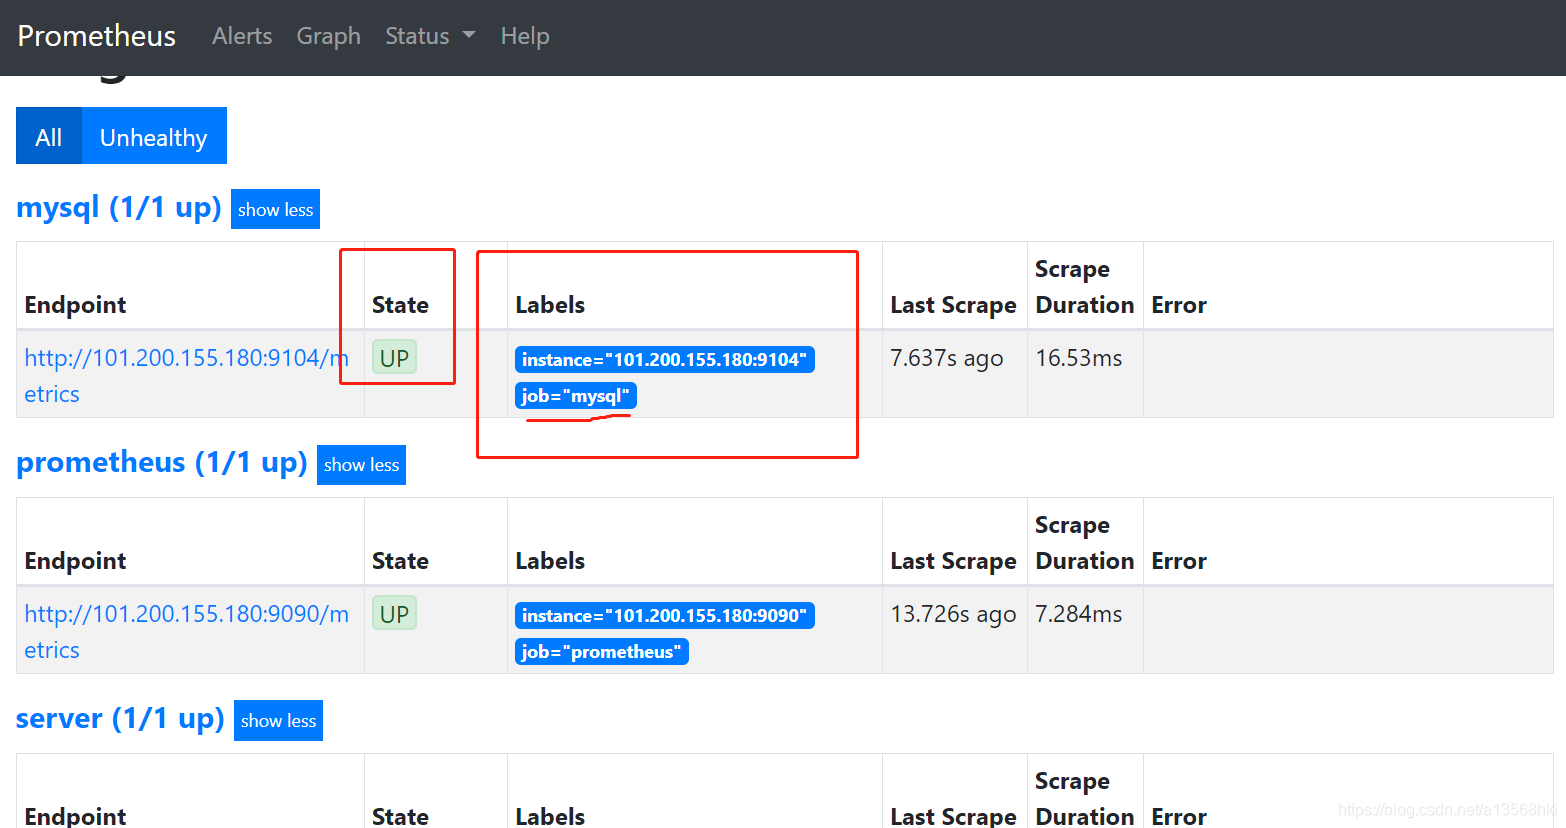
成功
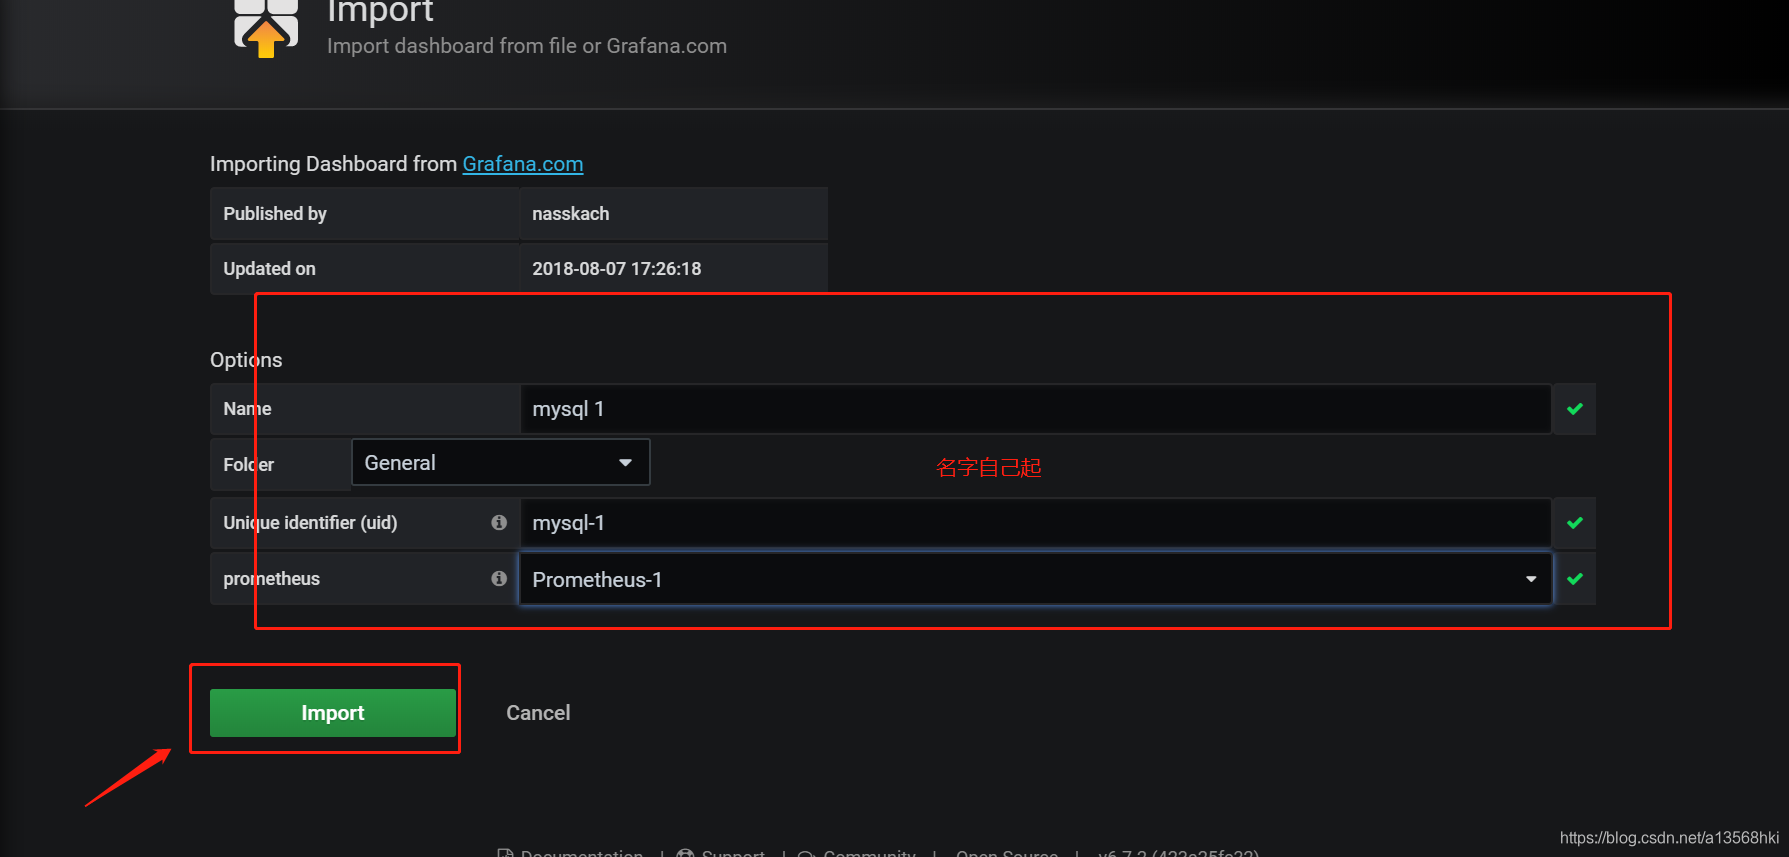
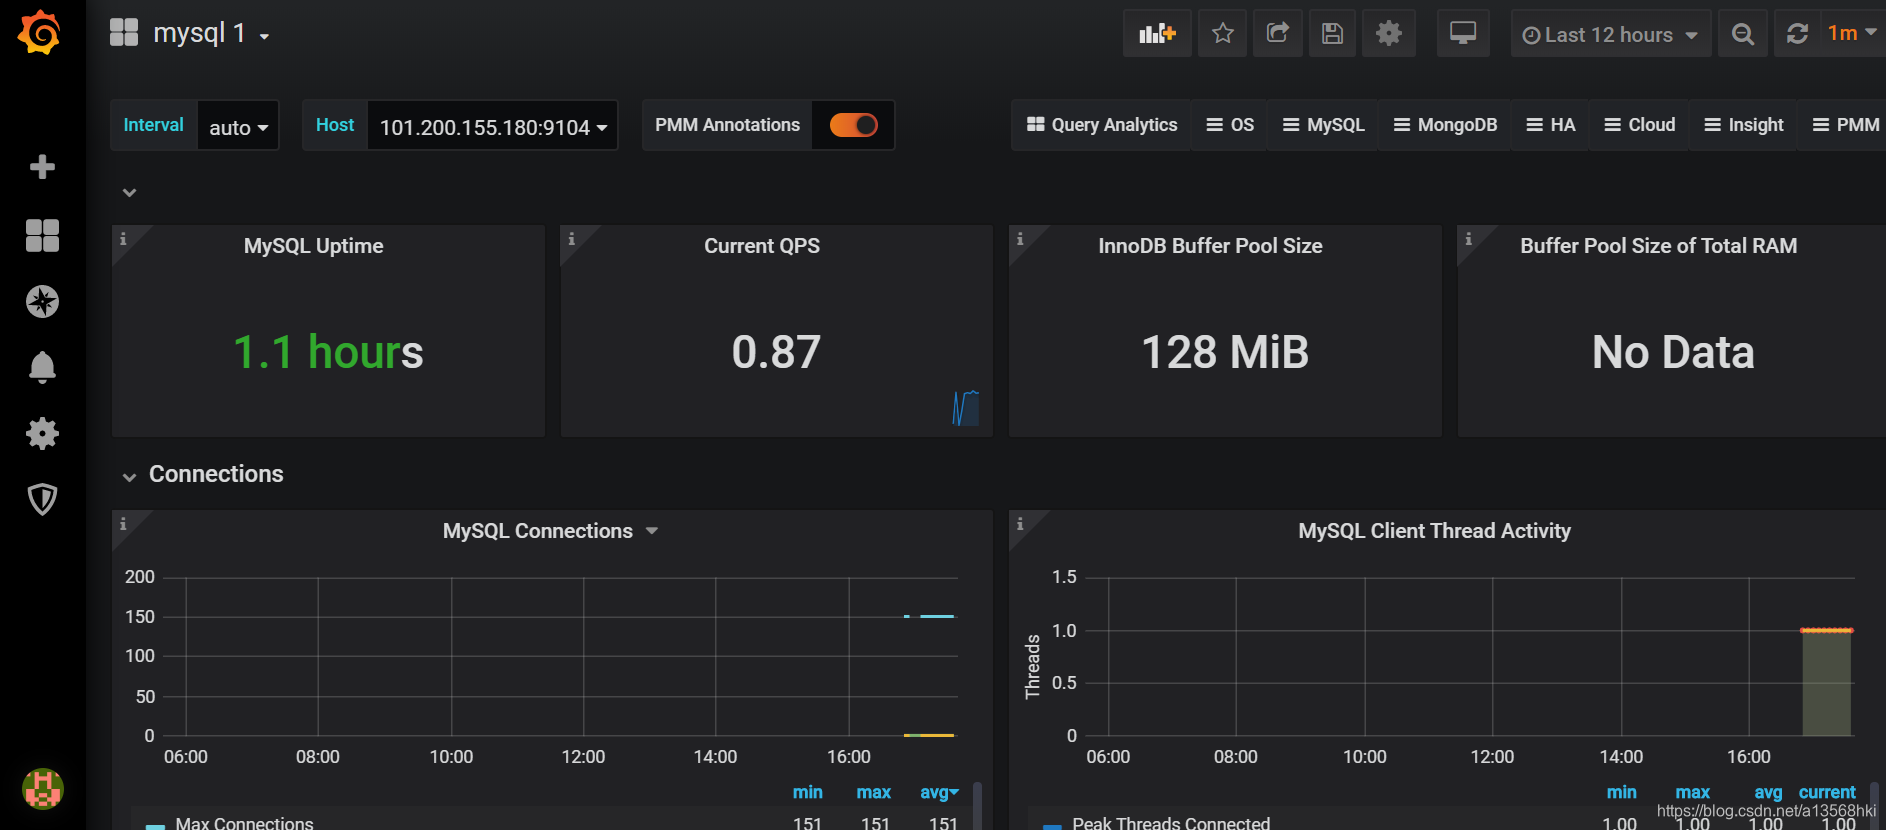
9、Granfana 导入Mysql监控模板
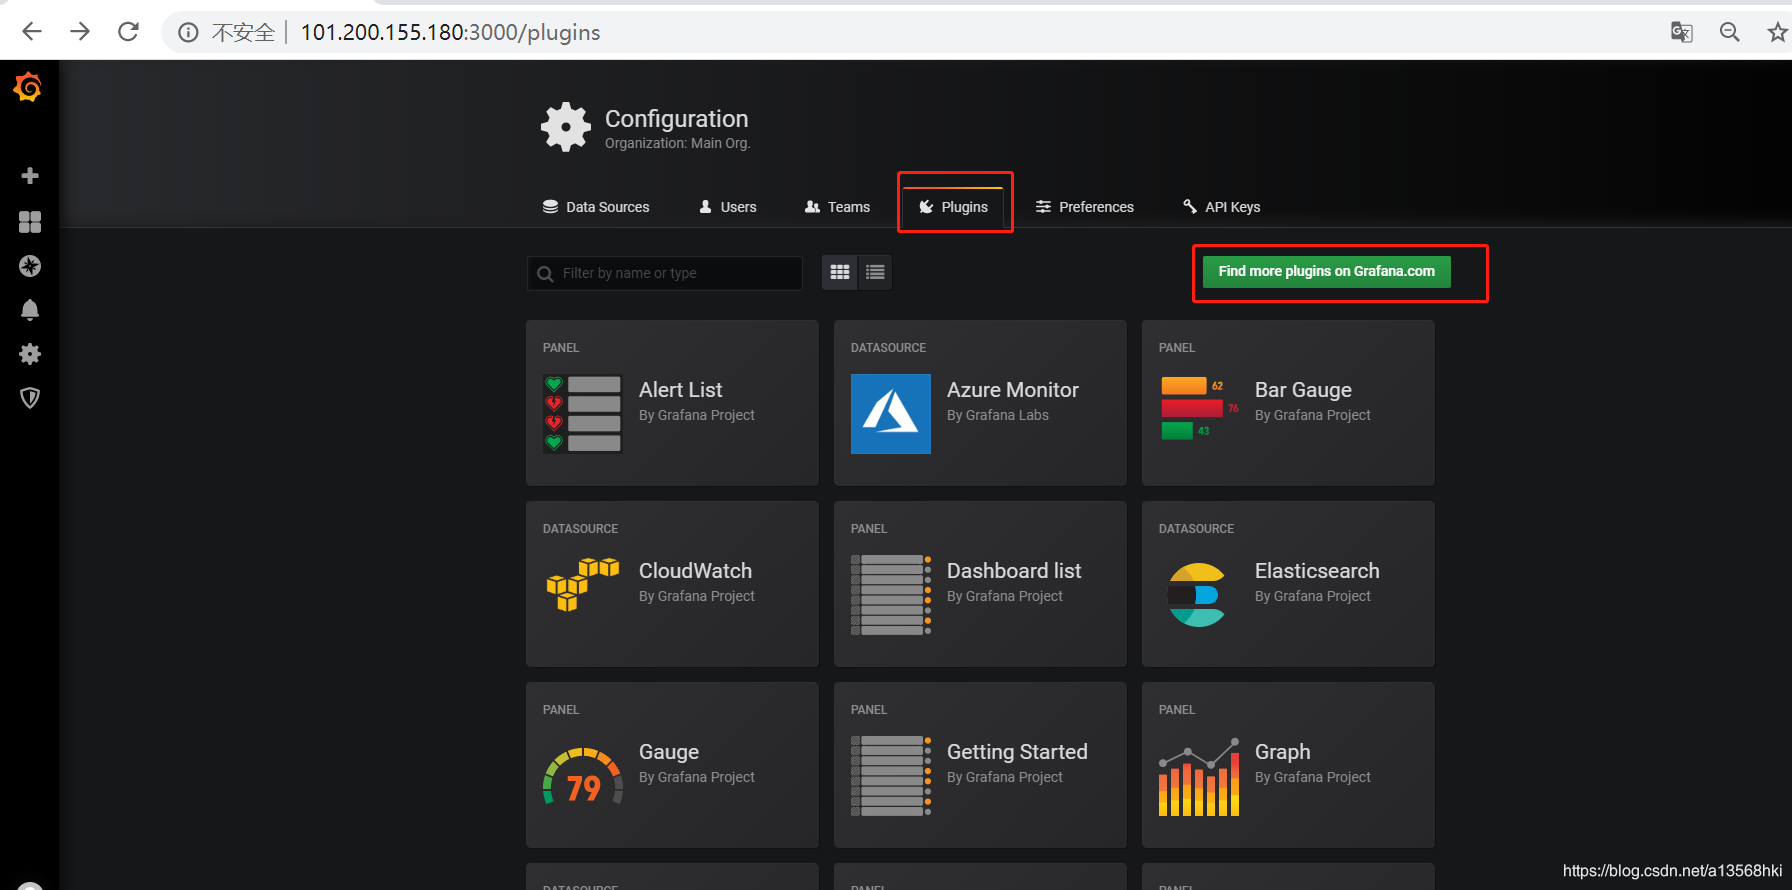
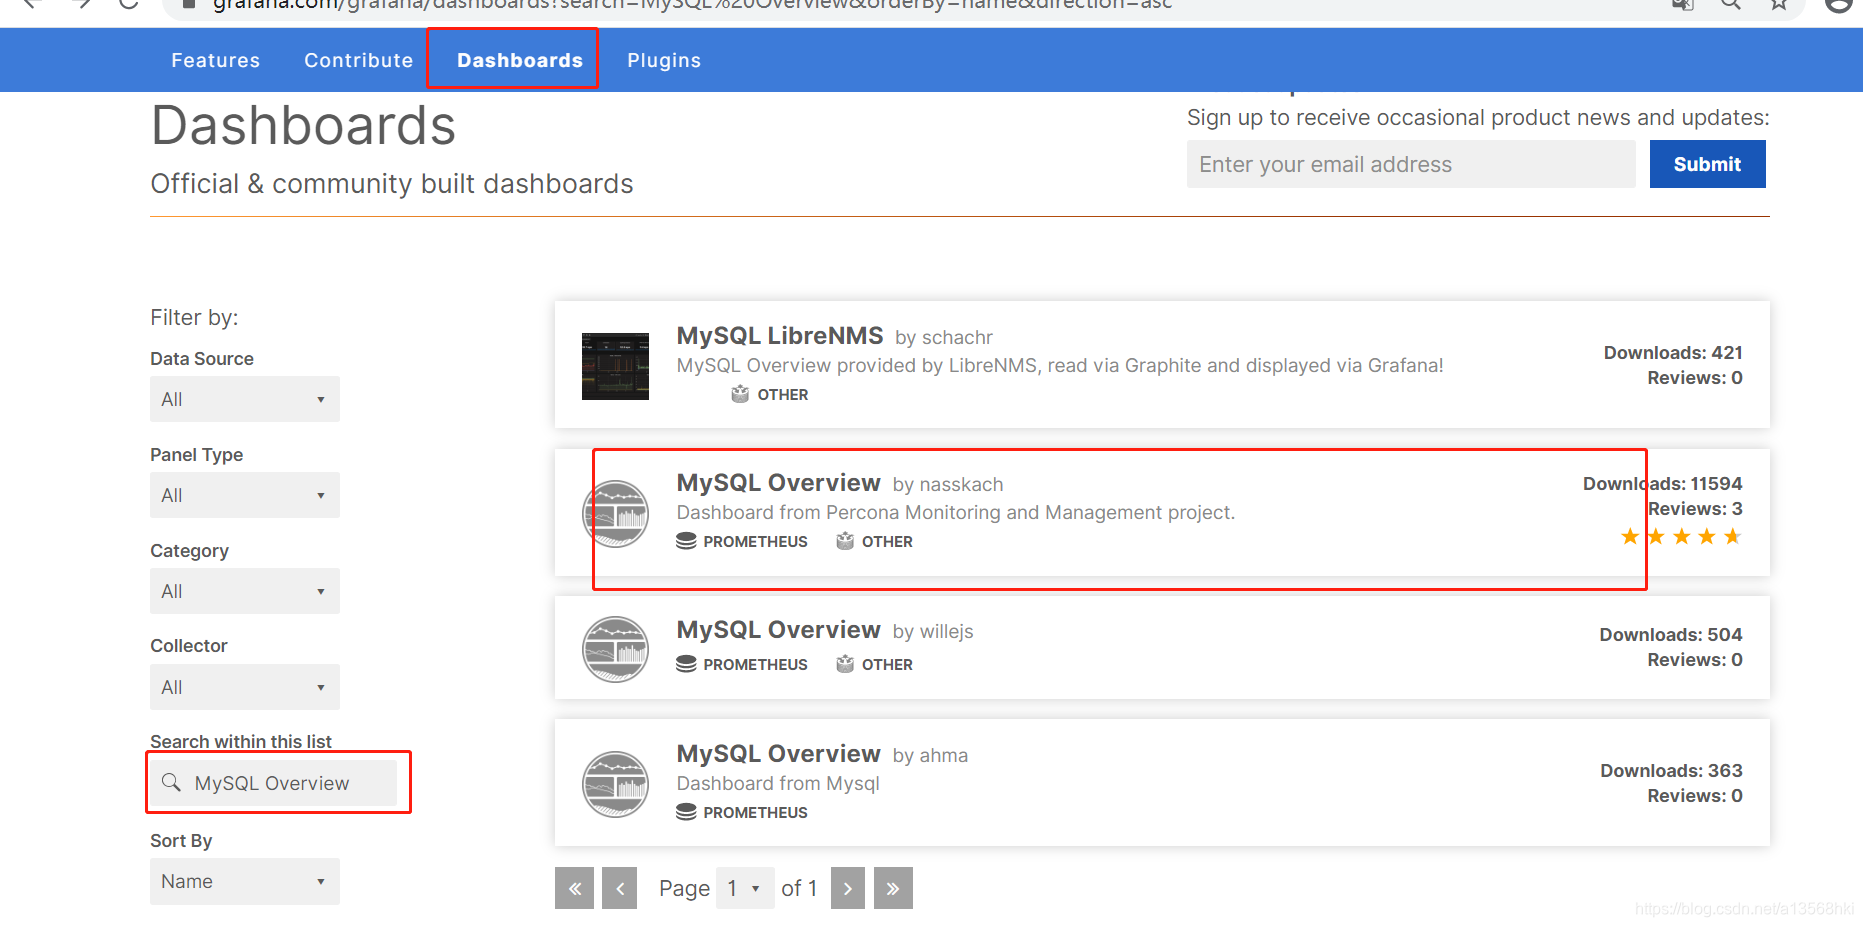
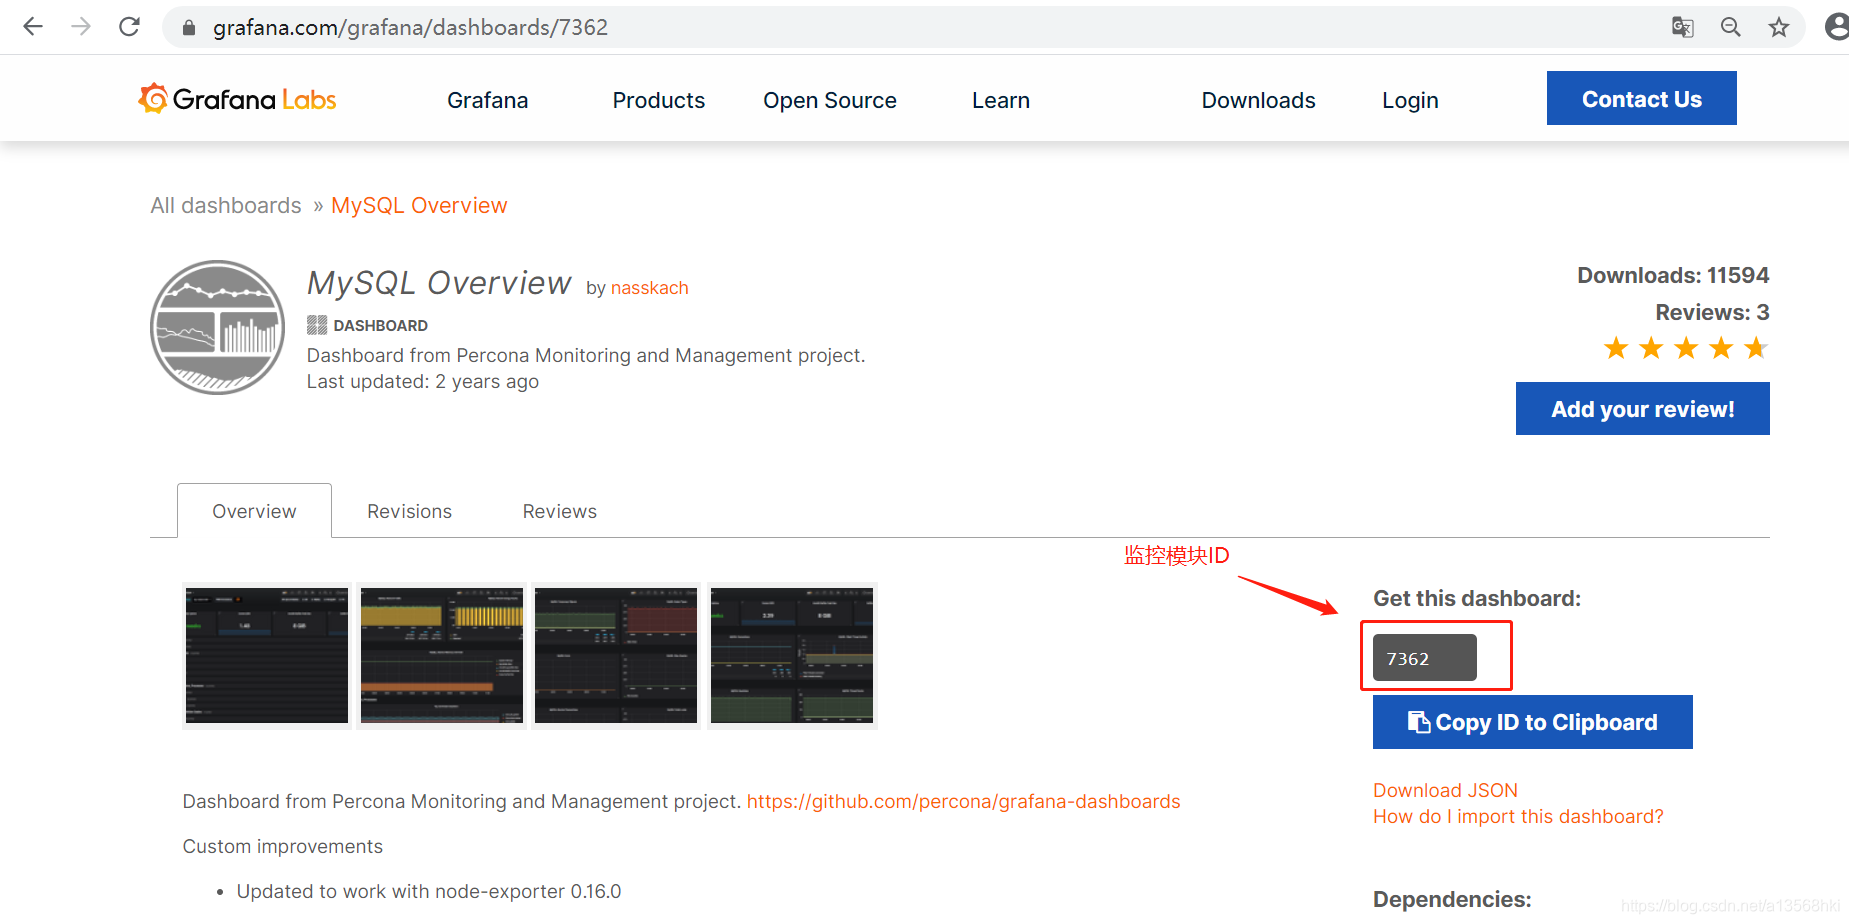
复制右边那个面板ID,然后在Import界面输入ID,Load后配置好数据源为我们的Prometheus,就可以出现我们自己机器的状态监控面板了,很炫酷吧。

成功
