第一步:引用头
<script src="~/vendors/Chart.js/Chart.js"></script>
第二步:
 <div style="width:75%;">
       <canvas id="myChart"></canvas>
 </div>
第三步:
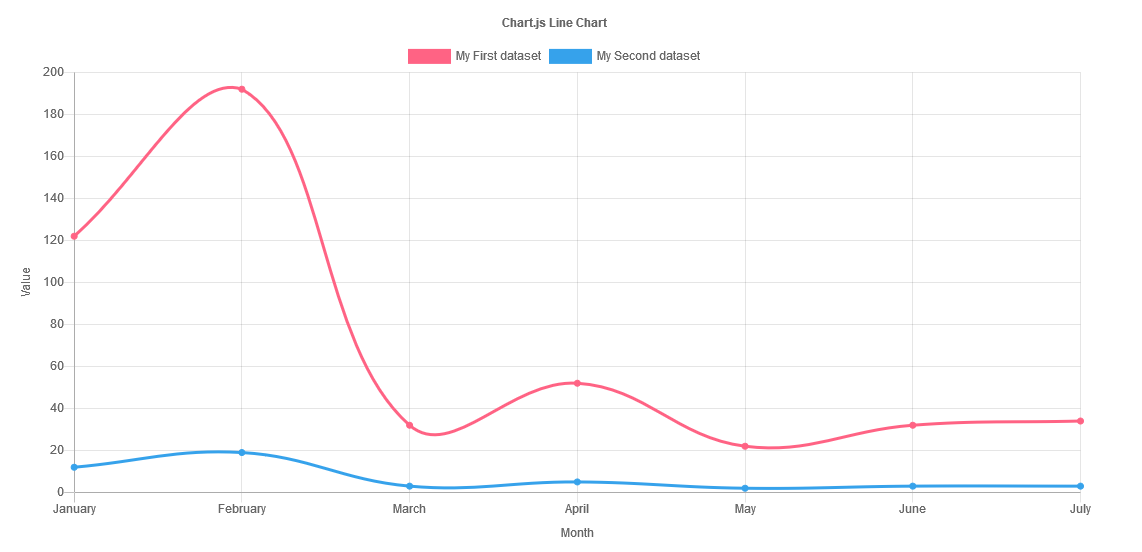
        window.chartColors = {
            red: 'rgb(255, 99, 132)',
            orange: 'rgb(255, 159, 64)',
            yellow: 'rgb(255, 205, 86)',
            green: 'rgb(75, 192, 192)',
            blue: 'rgb(54, 162, 235)',
            purple: 'rgb(153, 102, 255)',
            grey: 'rgb(201, 203, 207)'
        };

        var ctx = document.getElementById('myChart').getContext('2d');
        var chart = new Chart(ctx, {
            type: 'line',
            data: {
                labels: ['January', 'February', 'March', 'April', 'May', 'June', 'July'],
                datasets: [{
                    label: 'My First dataset',
                    backgroundColor: window.chartColors.red,
                    borderColor: window.chartColors.red,

                    data: [122, 192, 32, 52, 22, 32, 34],
                    fill: false,
                }, {
                    label: 'My Second dataset',
                    fill: false,
                    backgroundColor: window.chartColors.blue,
                    borderColor: window.chartColors.blue,
                    data: [12, 19, 3, 5, 2, 3, 3],
                }]
            },
            options: {
                responsive: true,
                title: {
                    display: true,
                    text: 'Chart.js Line Chart'
                },
                tooltips: {
                    mode: 'index',
                    intersect: false,
                },
                hover: {
                    mode: 'nearest',
                    intersect: true
                },
                scales: {
                    xAxes: [{
                        display: true,
                        scaleLabel: {
                            display: true,
                            labelString: 'Month'
                        }
                    }],
                    yAxes: [{
                        display: true,
                        scaleLabel: {
                            display: true,
                            labelString: 'Value'
                        }
                    }]
                }
            }
        });
最终效果如下: