基于python的招聘网站分析
立项背景:通过使用招聘网站的体验,发现对现在IT市场主流人才和技术需求缺乏宏观的掌握。
项目目标:通过运用python爬虫技术,爬取大型主流招聘网站关于大数据人才的需求,并通过后台分析,最终以玫瑰图,漏斗图,地图的形式展示当下市场主要需求。
项目流程图

51job_view.py
import urllib.request
import xlwt #使用xlwt模块写入Excel文件
import re #正则表达式
import urllib.parse #parse模块的作用:url的解析,合并,编码,解码
import time #时间模块
#模拟浏览器
header={
'Host':'search.51job.com',
'Upgrade-Insecure-Requests':'1',
'User-Agent':'Mozilla/5.0 (Linux; Android 6.0; Nexus 5 Build/MRA58N) AppleWebKit/537.36 (KHTML, like Gecko) Chrome/75.0.3770.80 Mobile Safari/537.36'
}
def getfront(page,item): #page是页数,item是输入的字符串
result = urllib.parse.quote(item) #先把字符串转成十六进制编码
ur1 = result+',2,'+ str(page)+'.html'
ur2 = 'https://search.51job.com/list/000000,000000,0000,00,9,99,'
res = ur2+ur1 #拼接网址
a = urllib.request.urlopen(res)
html = a.read().decode('gbk') # 读取源代码并转为unicode
return html
def getInformation(html):
#compile 函数用于编译正则表达式,生成一个正则表达式( Pattern )对象,供 match() 和 search() 这两个函数使用。
reg = re.compile(r'class="t1 ">.*? <a target="_blank" title="(.*?)" href="(.*?)".*? <span class="t2"><a target="_blank" title="(.*?)" href="(.*?)".*?<span class="t3">(.*?)</span>.*?<span class="t4">(.*?)</span>.*?<span class="t5">(.*?)</span>.*?',re.S)#匹配换行符
items=re.findall(reg,html)
return items
#新建表格空间
excel1 = xlwt.Workbook()
#新建一个sheet,设置单元格格式,cell_overwrite_ok=True防止对一个单元格重复操作引发的错误
sheet1 = excel1.add_sheet('Job', cell_overwrite_ok=True)
sheet1.write(0, 0, '序号')
sheet1.write(0, 1, '职位')
sheet1.write(0, 2, '公司名称')
sheet1.write(0, 3, '公司地点')
sheet1.write(0, 4, '公司性质')
sheet1.write(0, 5, '薪资')
sheet1.write(0, 6, '学历要求')
sheet1.write(0, 7, '工作经验')
sheet1.write(0, 8, '公司规模')
sheet1.write(0, 9, '公司类型')
sheet1.write(0, 10,'公司福利')
sheet1.write(0, 11,'发布时间')
number = 1 #保存到excel中第几条数据
item = input('请输入岗位关键词(与大数据相关职业):')
for j in range(1,10000): #页数自己随便改
try:
print("正在爬取第"+str(j)+"页数据...")
html = getfront(j,item) #调用获取网页原码
for i in getInformation(html):
try:
'''
i[0]:职位
i[1]:职位网址
i[2]:公司名称
i[4]:公司地点
i[5]:薪资
i[6]:发布时间
company[0][0]:公司性质
job_need[2][0]:学历要求
job_need[1][0]:工作经验
company[0][1]:公司规模
company[0][2]:公司类型
welfare:公司福利
'''
url1 = i[1] #职位网址
res1 = urllib.request.urlopen(url1).read().decode('gbk')
company = re.findall(re.compile(r'<div class="com_tag">.*?<p class="at" title="(.*?)"><span class="i_flag">.*?<p class="at" title="(.*?)">.*?<p class="at" title="(.*?)">.*?',re.S),res1)
job_need = re.findall(re.compile(r'<p class="msg ltype".*?>.*? <span>|</span> (.*?) <span>|</span> (.*?) <span>|</span> .*?</p>',re.S),res1)
welfare = re.findall(re.compile(r'<span class="sp4">(.*?)</span>',re.S),res1)
print(i[0],i[2],i[4],i[5],company[0][0],job_need[2][0],job_need[1][0],company[0][1],company[0][2],welfare,i[6])
sheet1.write(number,0,number)
sheet1.write(number,1,i[0])
sheet1.write(number,2,i[2])
sheet1.write(number,3,i[4])
sheet1.write(number,4,company[0][0])
sheet1.write(number,5,i[5])
sheet1.write(number,6,job_need[2][0])
sheet1.write(number,7,job_need[1][0])
sheet1.write(number,8,company[0][1])
sheet1.write(number,9,company[0][2])
sheet1.write(number,10,(" ".join(str(i) for i in welfare)))
sheet1.write(number,11,i[6])
number+=1
# 保存文件
excel1.save("51job.xls")
time.sleep(0.3) #休息间隔,避免爬取海量数据时被误判为攻击,IP遭到封禁
except:
pass
except:
pass
51job_view2.py
import pandas as pd #pandas 是对表格数据模型在python上的模拟,它有简单的像SQL 对数据的处理,能够方便的在python上实现
import re #正则表达式
data = pd.read_excel(r'51job.xls',sheet_name='Job')
result = pd.DataFrame(data) #将数据总表模板 加载
a = result.dropna(axis=0,how='any') #值为0则删除行 axis=1则是删除列,any是只要有空值就删除,而all则是全部为空再删除
# 还有一个inplace参数,True是在原数据集上操作,False是返回新的数据集
pd.set_option('display.max_rows',None) #输出全部行,不省略
#删除与大数据无关的职业
b = u'数据'
number = 1
li = a['职位']
for i in range(0,len(li)):
try:
if b in li[i]:
#print(number,li[i])
number+=1
else:
a = a.drop(i,axis=0) #删除整行
except:
pass
#学历表格那一栏出现招多少人,表示爬取数据出错,删除该行数据
b2 = '人'
li2 = a['学历要求']
for i in range(0,len(li2)):
try:
if b2 in li2[i]:
# print(number,li2[i])
number += 1
a = a.drop(i, axis=0)
except:
pass
#转换薪资单位为万/月
b3 =u'万/年'
b4 =u'千/月'
li3 = a['薪资']
for i in range(0,len(li3)):
try:
if b3 in li3[i]:
x = re.findall(r'\d*\.?\d+',li3[i])
#print(x)
min_ = format(float(x[0])/12,'.2f') #转换成浮点型并保留两位小数
max_ = format(float(x[1])/12,'.2f')
li3[i][1] = min_+'-'+max_+u'万/月'
if b4 in li3[i]:
x = re.findall(r'\d*\.?\d+',li3[i])
#print(x)
#input()
min_ = format(float(x[0])/10,'.2f')
max_ = format(float(x[1])/10,'.2f')
li3[i][1] = str(min_+'-'+max_+'万/月')
print(i,li3[i])
except:
pass
#保存到另一个Excel文件
a.to_excel('51job2.xls', sheet_name='Job', index=False) #index :布尔类型,默认是Ture写行名(索引)
#############################################################################################
import pandas as pd #pandas 是对表格数据模型在python上的模拟,它有简单的像SQL 对数据的处理,能够方便的在python上实现
import re #正则表达式
from pyecharts import Funnel,Pie,Geo #pyecharts 是一个用于生成 Echarts 图表的类库。
#Funnel(漏斗图)、Pie(饼图)、Geo(地理坐标系)
import matplotlib.pyplot as plt #用于数据可视化。
file = pd.read_excel(r'51job2.xls',sheet_name='Job')
f = pd.DataFrame(file) #将数据总表模板 加载
pd.set_option('display.max_rows',None) #输出全部行,不省略
add = f['公司地点'] #公司地点数据的集合
sly = f['薪资'] #薪资数据的集合
edu = f['学历要求'] #学历要求的集合
exp = f['工作经验'] #工作经验的集合
address =[]
salary = []
education = []
experience = []
for i in range(0,len(f)):
try:
a = add[i].split('-') #通过'-',将字符串add[i]拆分成一个字符串数组
address.append(a[0]) #只要前面的
#print(address[i])
s = re.findall(r'\d*\.?\d+',sly[i]) # sly[i]的薪资
s1= float(s[0]) #最低工资
s2 =float(s[1]) #最高工资
salary.append([s1,s2]) #将薪资添加到salary列表
#print(salary[i])
education.append(edu[i]) #将学历要求添加到education列表
#print(education[i])
experience.append(exp[i]) #将工作经验添加到experience列表
#print(experience[i])
except:
pass
min_s=[] #定义存放最低薪资的列表
max_s=[] #定义存放最高薪资的列表
for i in range(0,len(experience)):
min_s.append(salary[i][0])
max_s.append(salary[i][1])
#matplotlib模块如果显示不了中文字符串可以用以下代码。
plt.rcParams['font.sans-serif'] = ['KaiTi'] # 指定默认字体
plt.rcParams['axes.unicode_minus'] = False # 解决保存图像是负号'-'显示为方块的问题
my_df = pd.DataFrame({'experience':experience, 'min_salay' : min_s, 'max_salay' : max_s}) #关联工作经验与薪资
data1 = my_df.groupby('experience').mean()['min_salay'].plot(kind='line')
plt.show()
my_df2 = pd.DataFrame({'education':education, 'min_salay' : min_s, 'max_salay' : max_s}) #关联学历与薪资
data2 = my_df2.groupby('education').mean()['min_salay'].plot(kind='line')
plt.show()
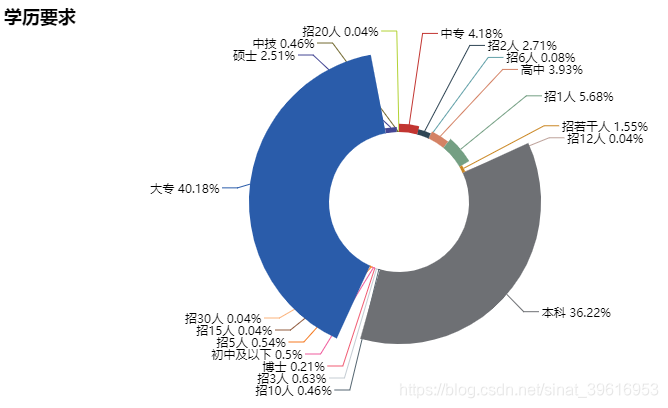
#统计岗位中各学历要求的个数
def get_edu(list):
education2 = {}
for i in set(list):
education2[i] = list.count(i)
return education2
dir1 = get_edu(education)
#print(dir1)
#将岗位中各学历要求的个数绘制成饼图
attr= dir1.keys()
value = dir1.values()
pie = Pie("学历要求")
pie.add("", attr, value, center=[50, 50], is_random=False, radius=[35, 75], rosetype='radius',
is_legend_show=False, is_label_show=True,legend_orient='vertical')
pie.render('学历要求饼图.html')
#统计各地区岗位个数
def get_address(list):
address2 = {}
for i in set(list):
address2[i] = list.count(i)
address2.pop('异地招聘')
# 有些地名可能不合法或者地图包里没有可以自行删除。
return address2
dir2 = get_address(address)
#print(dir2)
#将各地区岗位个数绘制成地理坐标图
geo = Geo("大数据人才需求分布图", title_color="#2E2E2E",
title_text_size=24,title_top=20,title_pos="center", width=1300,height=600)
attr2 = dir2.keys()
value2 = dir2.values()
geo.add("",attr2, value2, type="effectScatter", is_random=True, visual_range=[0, 1000], maptype='china',symbol_size=8, effect_scale=5, is_visualmap=True)
geo.render('大数据城市需求分布图.html')
#统计各学历要求岗位个数
def get_experience(list):
experience2 = {}
for i in set(list):
experience2[i] = list.count(i)
return experience2
dir3 = get_experience(experience)
#print(dir3)
#将各学历要求岗位个数绘制成漏斗图
attr3= dir3.keys()
value3 = dir3.values()
funnel = Funnel("工作经验漏斗图",title_pos='center')
funnel.add("", attr3, value3,is_label_show=True,label_pos="inside", label_text_color="#fff",legend_orient='vertical',legend_pos='left')
funnel.render('工作经验要求漏斗图.html')
| 环境 | 版本 |
|---|---|
| python | 3.6 |
| urllib3 | 1.24.3 |
| xlwt | 1.3.0 |
| pandas | 0.25.3 |
| pyecharts | 0.1.94 |
项目运行效果图


源码下载链接:基于python的招聘网站分析源码下载
本项目引用自:python爬取前程无忧和拉勾数据分析岗位并分析(https://blog.csdn.net/lbship/article/details/79452459)
