直方图全局均衡化
from skimage import exposure
# Equalization
img_eq = exposure.equalize_hist(img)
直方图自适应均衡化
# Adaptive Equalization
# 参数2:Clipping limit, normalized between 0 and 1 (higher values give more contrast).
img_adapteq = exposure.equalize_adapthist(img, clip_limit=0.03)
直方图对比度拉伸
# Contrast stretching
p2, p98 = np.percentile(img, (2, 98))
img_rescale = exposure.rescale_intensity(img, in_range=(p2, p98))
实验:直方图全局均衡化、自适应均衡化、对比度拉伸效果对比
"""
======================
Histogram Equalization
======================
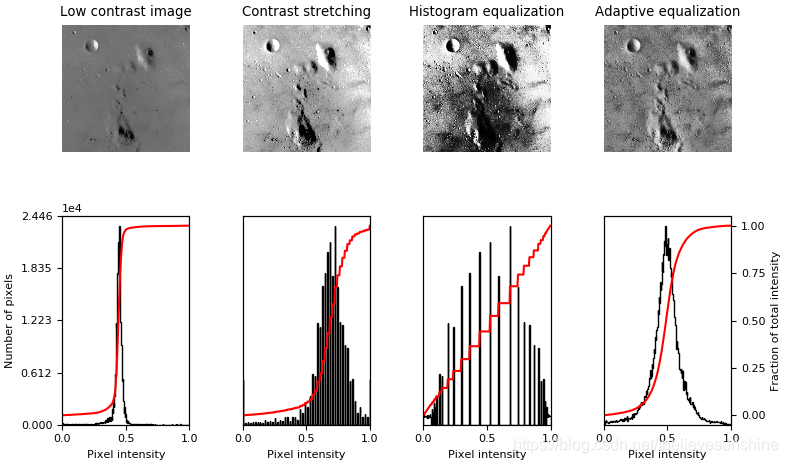
This examples enhances an image with low contrast, using a method called
*histogram equalization*, which "spreads out the most frequent intensity
values" in an image. The equalized image has a roughly linear cumulative
distribution function.
While histogram equalization has the advantage that it requires no parameters,
it sometimes yields unnatural looking images. An alternative method is
*contrast stretching*, where the image is rescaled to include all intensities
that fall within the 2nd and 98th percentiles.
"""
import matplotlib
import matplotlib.pyplot as plt
import numpy as np
from skimage import data, img_as_float
from skimage import exposure
matplotlib.rcParams['font.size'] = 8
def plot_img_and_hist(image, axes, bins=256):
"""Plot an image along with its histogram and cumulative histogram.
"""
image = img_as_float(image)
ax_img, ax_hist = axes
# 共用x轴
ax_cdf = ax_hist.twinx()
# Display image
ax_img.imshow(image, cmap=plt.cm.gray)
ax_img.set_axis_off()
# Display histogram
ax_hist.hist(image.ravel(), bins=bins, histtype='step', color='black')
ax_hist.ticklabel_format(axis='y', style='scientific', scilimits=(0, 0))
ax_hist.set_xlabel('Pixel intensity')
ax_hist.set_xlim(0, 1)
ax_hist.set_yticks([])
# Display cumulative distribution
img_cdf, bins = exposure.cumulative_distribution(image, bins)
ax_cdf.plot(bins, img_cdf, 'r')
# 设置右侧坐标轴为空
ax_cdf.set_yticks([])
return ax_img, ax_hist, ax_cdf
# Load an example image
img = data.moon()
# Contrast stretching
p2, p98 = np.percentile(img, (2, 98))
img_rescale = exposure.rescale_intensity(img, in_range=(p2, p98))
# Equalization
img_eq = exposure.equalize_hist(img)
# Adaptive Equalization
# 参数2:Clipping limit, normalized between 0 and 1 (higher values give more contrast).
img_adapteq = exposure.equalize_adapthist(img, clip_limit=0.03)
# Display results
fig = plt.figure(figsize=(8, 5))
axes = np.zeros((2, 4), dtype=np.object)
axes[0, 0] = fig.add_subplot(2, 4, 1)
for i in range(1, 4):
axes[0, i] = fig.add_subplot(2, 4, 1+i, sharex=axes[0,0], sharey=axes[0,0])
for i in range(0, 4):
axes[1, i] = fig.add_subplot(2, 4, 5+i)
ax_img, ax_hist, ax_cdf = plot_img_and_hist(img, axes[:, 0])
ax_img.set_title('Low contrast image')
y_min, y_max = ax_hist.get_ylim()
ax_hist.set_ylabel('Number of pixels')
# 左侧y轴范围为0到y_max,5个刻度
ax_hist.set_yticks(np.linspace(0, y_max, 5))
ax_img, ax_hist, ax_cdf = plot_img_and_hist(img_rescale, axes[:, 1])
ax_img.set_title('Contrast stretching')
ax_img, ax_hist, ax_cdf = plot_img_and_hist(img_eq, axes[:, 2])
ax_img.set_title('Histogram equalization')
ax_img, ax_hist, ax_cdf = plot_img_and_hist(img_adapteq, axes[:, 3])
ax_img.set_title('Adaptive equalization')
ax_cdf.set_ylabel('Fraction of total intensity')
# 右侧y轴范围为0到1,5个刻度
ax_cdf.set_yticks(np.linspace(0, 1, 5))
# prevent overlap of y-axis labels
fig.tight_layout()
plt.show()