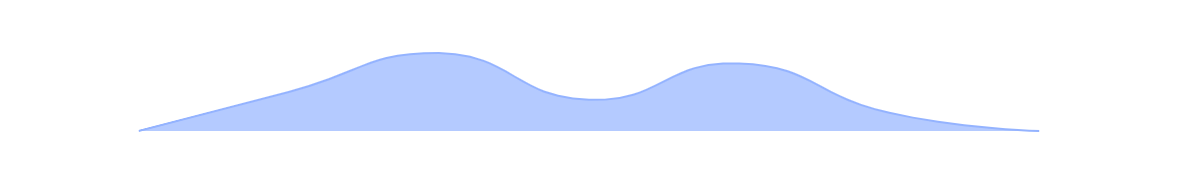
echarts的初始化面积图
//引入
<script src="/static/indicator/echarts.common.min.js"></script>
//html

<div id="workCountLine" class="workCount-down"></div>
//js

//初始化人员工作统计echarts图
function initWorkCountCharts() {

    // 指定图表的配置项和数据
    option = {
        tooltip: {
            trigger: 'axis',
            axisPointer: { // 坐标轴指示器,坐标轴触发有效
                type: 'shadow' // 默认为直线,可选为:'line' | 'shadow'
            }
        },
        xAxis: {
            type: 'category',
            boundaryGap: false,
            data: ['2019.01.01', '2019.02.12', '2019.03.03', '2019.04.16', '2019.05.20', '2019.06.08', '2019.07.31'],
            show: false
        },
        yAxis: {
            type: 'value',
            show: false
        },
        series: [{
            data: [0, 15, 30, 12, 26, 7, 0],
            type: 'line',
            smooth: true,
            symbol: 'circle', // 拐点类型
            symbolSize: 0,
            areaStyle: {
                normal: {
                    color: '#94B3FF' //改变区域颜色
                }
            },
            itemStyle: {
                normal: {
                    color: '#94B3FF', //改变折线点的颜色
                    lineStyle: {
                        color: '#94B3FF' //改变折线颜色
                    }
                }
            },
        }]
    };
    //下面的面积图
    myChart = echarts.init(document.getElementById('workCountLine'));
    console.log(myChart)
    // 使用刚指定的配置项和数据显示图表。
    myChart.setOption(option);
}


$(document).ready(function(){//页面初始化
	initWorkCountCharts()
})
//html
<div id="workCountBar" class="workCount-content"></div>
//初始化人员工作统计echarts图
function initWorkCountCharts() {
//上面的柱形图
myChart = echarts.init(document.getElementById('workCountBar'));
option = {
tooltip: {
trigger: 'axis',
axisPointer: { // 坐标轴指示器,坐标轴触发有效
type: 'shadow' // 默认为直线,可选为:'line' | 'shadow'
}
},
grid: {
left: '3%',
right: '4%',
bottom: '10%',
containLabel: true
},
xAxis: [{
type: 'category',
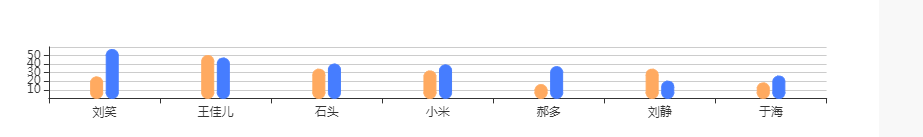
data: ['刘笑', '王佳儿', '石头', '小米', '郝多', '刘静', '于海']
}],
yAxis: [{
type: 'value'
}],
series: [{
name: '编写用例数',
type: 'bar',
data: [25, 50, 34, 32, 16, 34, 18],
barWidth: 12,
itemStyle: {
normal: {
color: '#FFAA60', // 折线条的颜色
borderColor: '#FFAA60', // 拐点边框颜色
barBorderRadius: 10
}
}
},
{
name: '测试执行执行数',
type: 'bar',
data: [57, 47, 40, 39, 37, 20, 26],
barWidth: 12,
itemStyle: {
normal: {
color: '#467DFF', // 折线条的颜色
borderColor: '#467DFF', // 拐点边框颜色
barBorderRadius: 10
}
}
}
]
};
myChart.setOption(option);
}
$(document).ready(function(){//页面初始化
initWorkCountCharts()
})
//html
<div class="exceptionSubmit-down" id="exceptionSubmitLine"></div>
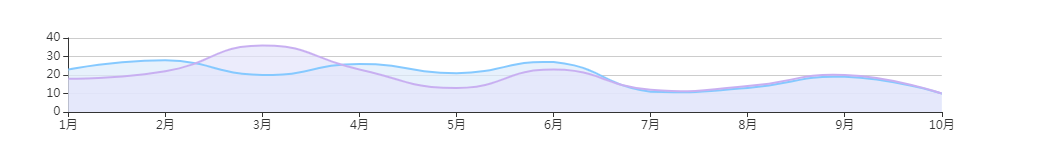
//初始化异常提交趋势图
function initExceptionSubmitLine() {
myChart = echarts.init(document.getElementById('exceptionSubmitLine'));
// 指定图表的配置项和数据
option = {
tooltip: {
trigger: 'axis',
axisPointer: { // 坐标轴指示器,坐标轴触发有效
type: 'shadow' // 默认为直线,可选为:'line' | 'shadow'
}
},
xAxis: {
type: 'category',
boundaryGap: false,
data: ['1月', '2月', '3月', '4月', '5月', '6月', '7月', '8月', '9月', '10月'],
// show: false
},
yAxis: {
type: 'value',
// show: false
},
series: [{
name: '总数',
data: [23, 28, 20, 26, 21, 27, 11, 13, 19, 10],
type: 'line',
smooth: true,
symbol: 'circle', // 拐点类型
symbolSize: 0,
areaStyle: {
normal: {
color: '#DDEBFB' //改变区域颜色
}
},
itemStyle: {
normal: {
color: '#85C9FF', //改变折线点的颜色
lineStyle: {
color: '#85C9FF' //改变折线颜色
}
}
},
},
{
name: '未闭环',
data: [18, 22, 36, 23, 13, 23, 12, 14, 20, 10],
type: 'line',
smooth: true,
symbol: 'circle', // 拐点类型
symbolSize: 0,
areaStyle: {
normal: {
color: '#E4E4FB' //改变区域颜色
}
},
itemStyle: {
normal: {
color: '#C8AFF1', //改变折线点的颜色
lineStyle: {
color: '#C8AFF1' //改变折线颜色
}
}
},
}
]
};
// 使用刚指定的配置项和数据显示图表。
myChart.setOption(option);
}
$(document).ready(function(){//页面初始化
initExceptionSubmitLine()
})
<div class="exceptionAnalysis-body-down" id="exceptionAnalysisPie"></div>

//初始化异常分析饼图
function initExceptionAnalysisPie() {
    myChart = echarts.init(document.getElementById('exceptionAnalysisPie'));

    // 指定图表的配置项和数据
    option = {
        title: {
            text: '各分析异常',
            textStyle: {
                color: "#FF808E",
                fontSize: 16
            },
            left: "middle"
        },
        tooltip: {
            trigger: 'item',
            formatter: "{a} <br/>{b}: {c} ({d}%)"
        },
        legend: {
            orient: 'vertical',
            x: 'right',
            data: ['测控分系统', '遥测分系统', '电源分系统', '测控', '遥感', '其他'],
            // itemWidth: 50,
            // itemHeight: 25
        },
        series: [{
            name: '访问来源',
            type: 'pie',
            radius: ['50%', '70%'],
            avoidLabelOverlap: false,
            label: {
                normal: {
                    show: false,
                    position: 'center'
                },
                emphasis: {
                    show: true,
                    textStyle: {
                        fontSize: '30',
                        fontWeight: 'bold'
                    }
                }
            },
            labelLine: {
                normal: {
                    show: false
                }
            },
            data: [{
                    value: 36,
                    name: '测控分系统',
                    itemStyle: {
                        normal: {
                            color: '#FF79BE'
                        }
                    },
                },
                {
                    value: 20,
                    name: '遥测分系统',
                    itemStyle: {
                        normal: {
                            color: '#E5ADFA'
                        }
                    },
                },
                {
                    value: 36,
                    name: '电源分系统',
                    itemStyle: {
                        normal: {
                            color: '#87DACE'
                        }
                    },
                },
                {
                    value: 36,
                    name: '测控',
                    itemStyle: {
                        normal: {
                            color: '#5D87F6'
                        }
                    },
                },
                {
                    value: 9,
                    name: '遥感',
                    itemStyle: {
                        normal: {
                            color: '#5DB2FA'
                        }
                    },
                },
                {
                    value: 9,
                    name: '其他',
                    itemStyle: {
                        normal: {
                            color: '#FFAD49'
                        }
                    },
                }
            ]
        }]
    };

    // 使用刚指定的配置项和数据显示图表。
    myChart.setOption(option);
}

$(document).ready(function(){//页面初始化
	initExceptionAnalysisPie()
})

