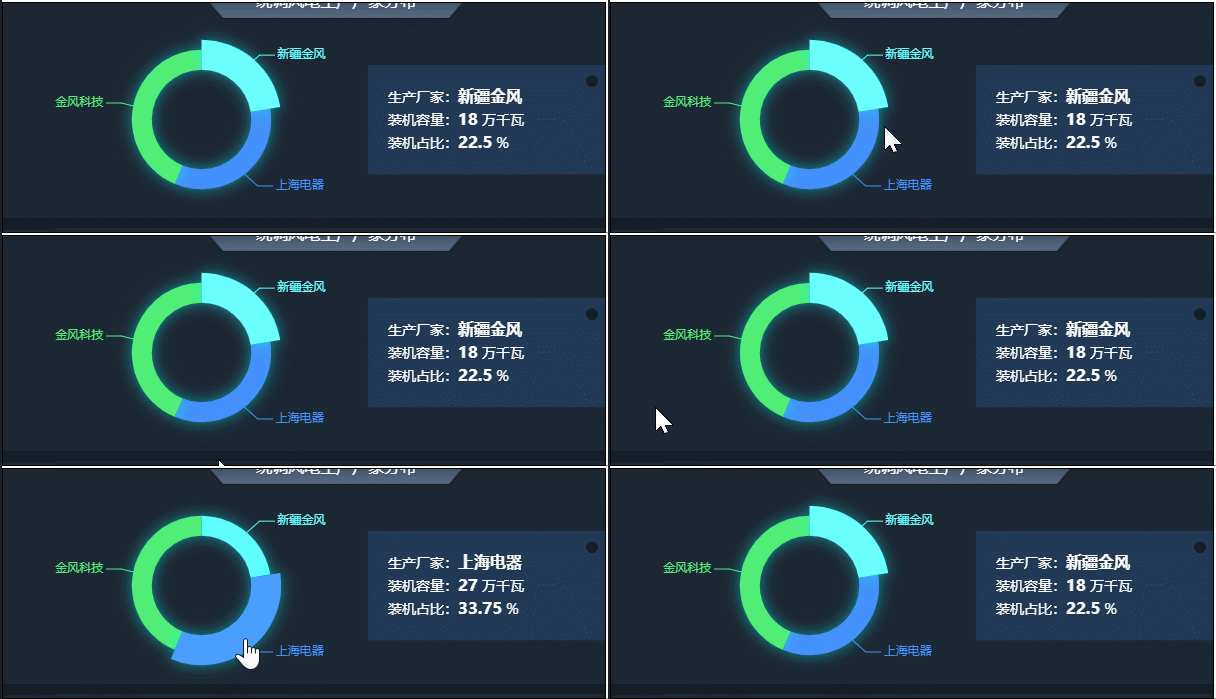
效果图:

代码:
var data = [
    {name:'新疆金风',value:18,percent: 22.5},
    {name:'上海电器',value:27,percent: 33.75},
    {name:'金风科技',value:35,percent: 43.75}
];
initEchartPie("plantDisPie", data);

function initEchartPie(id, data, color=["#62FFFF", "#4591FF", "#50EE77"]) {
    // 基于准备好的dom,初始化echarts实例
    var myChart = echarts.init(document.getElementById(id));
    myChart.clear();
    myChart.showLoading();
    var option = {
        // 提示
        tooltip: {
            trigger: 'item',
            // 设置提示框的位置
            position: ["90%", "20%"],
            // 设为空值  去掉提示框默认的背景色
            backgroundColor: '',
            // 是否设置让提示框的内容一直显示  默认值是false
            alwaysShowContent: true,
            formatter: (params)=> {
                var name = params.name;
                 return `
                         <div style='font-size:14px;line-height:22px;background-color:#213a55;width:200px;height: 100%;padding:20px;position:relative'>
                             <span style="position:absolute;width:12px;height:12px;top:10px;right:10px;background-color:#151D28;border-radius:50%"></span>
                             <p>生产厂家:<span style='font-weight:bold;font-size:16px'>${params.name}</span></p>
                             <p>装机容量:<span style='font-weight:bold;font-size:16px'>${params.value}</span> 万千瓦</p>
                             <p>装机占比:<span style='font-weight:bold;font-size:16px'>${params.percent}</span> %</p>
                         </div>
                        `
            }
        },
        color: color,
        calculable : true,
        series : [
            {
                type:'pie',
                itemStyle : {
                    normal : {
                        // 设置图形阴影
                    	shadowBlur: 14,
                        shadowColor: 'rgba(0,255,255,0.5)',
                        shadowOffsetX: 0,
                        shadowOffsetY: 0,
                        label : {
                            show : true
                        },
                        labelLine : {
                            show : true
                        }
                    },
                    emphasis : {
                        label : {
                            show : true
                        }
                    }
                },
                radius : ['50%', '70%'],
                data: data
            }
        ]
    };

    // 使用刚指定的配置项和数据显示图表。
    myChart.setOption(option);
    myChart.hideLoading();
    // 默认高亮第一条数据和展示第一条数据的提示框
    myChart.dispatchAction({
        type: 'showTip',
        seriesIndex: 0,
        dataIndex: 0
    });
    myChart.dispatchAction({
        type: 'highlight',
        seriesIndex: 0,
        dataIndex: 0
    });
    myChart.on('mouseover',(v) => {
        console.log('mouseover')
        if(v.dataIndex != 0){
            myChart.dispatchAction({
                type: 'hideTip',
                seriesIndex: 0,
                dataIndex: 0
            });
            myChart.dispatchAction({
                type: 'downplay',
                seriesIndex: 0,
                dataIndex: 0
            });
        }
    });

    myChart.on('mouseout',(v) => {
        console.log('mouseout')
        myChart.dispatchAction({
            type: 'showTip',
            seriesIndex: 0,
            dataIndex: 0
        });
        myChart.dispatchAction({
            type: 'highlight',
            seriesIndex: 0,
            dataIndex: 0
        });
    });
};