1.动态式显示:
import tensorflow as tf
import numpy as np
import matplotlib.pyplot as plt


def add_layer(inputs, in_size, out_size, activation_funiction=None):
    Weights = tf.Variable(tf.random_normal([in_size, out_size]))
    biases = tf.Variable(tf.zeros([1, out_size]) + 0.1)
    Wx_plus_b = tf.matmul(inputs, Weights) + biases
    if activation_funiction is None:
        outputs = Wx_plus_b
    else:
        outputs = activation_funiction(Wx_plus_b)
    return outputs


x_data = np.linspace(-1, 1, 300)[:, np.newaxis]
print(x_data.shape)
noise = np.random.normal(0, 0.05, x_data.shape)
print(noise[:3])
y_data = np.square(x_data) - 0.5 + noise

xs = tf.placeholder(tf.float32, [None, 1])
ys = tf.placeholder(tf.float32, [None, 1])

# add hidden layer
l1 = add_layer(xs, 1, 10, activation_funiction=tf.nn.relu)
# add output layer
prediction = add_layer(l1, 10, 1, activation_funiction=None)

# the error between prediction and real data
loss = tf.reduce_mean(tf.reduce_sum(tf.square(ys - prediction), reduction_indices=[1]))
train_step = tf.train.GradientDescentOptimizer(0.1).minimize(loss)

init = tf.initialize_all_variables()

with tf.Session() as sess:
    sess.run(init)

    fig = plt.figure()
    ax = fig.add_subplot(1, 1, 1)
    ax.scatter(x_data, y_data, s=2)
    plt.ion()  # 将画图模式改为交互模式

    for i in range(1000):
        sess.run(train_step, feed_dict={xs: x_data, ys: y_data})
        if i % 50 == 0:
            plt.pause(0.1)
            try:
                ax.lines.remove(lines[0])
            except Exception:
                pass
            prediction_value = sess.run(prediction, feed_dict={xs: x_data})
            lines = ax.plot(x_data, prediction_value, 'r-', lw=2)

            print(sess.run(loss, feed_dict={xs: x_data, ys: y_data}))

    plt.ioff()
    plt.show()
效果图如下:

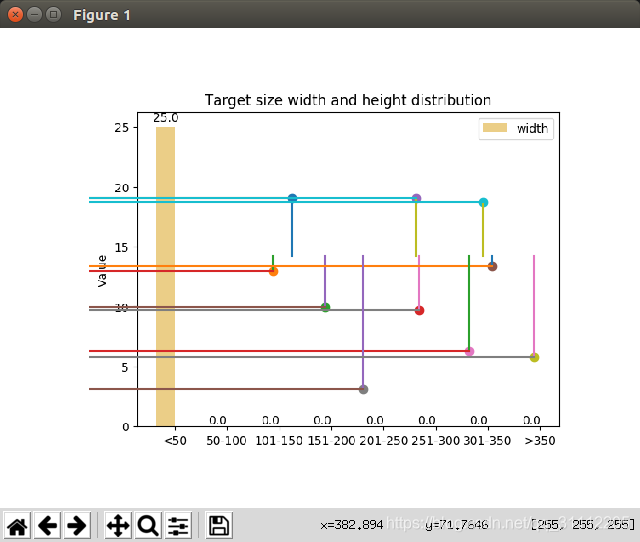
2.交互式显示:
from matplotlib import pyplot as plt
import cv2

def on_press(event):
    if event.button == 1:  # 点击鼠标左键画图
        ax.scatter(event.xdata, event.ydata)
        plt.plot([event.xdata, event.xdata], [event.ydata, 200])
        plt.plot([event.xdata, 0], [event.ydata, event.ydata])
        fig.canvas.draw()
    elif event.button == 3:  # 点击鼠标邮件输出坐标
        print("x,y=", event.xdata, event.ydata)
if __name__ == "__main__":
    img = cv2.imread('01.png')
    #cv2.imshow("src", img)
    fig = plt.figure()
    fig.canvas.mpl_connect("button_press_event", on_press)
    ax = fig.add_subplot(111)
    ax.imshow(img)
    plt.axis("off")
    plt.show()
    #cv2.waitKey(0)
点击图片就回出现一个直角,如下: