参考
层级
最高级:the matplotlib “state-machine environment”。看下面的例子,全程使用plt模块的函数做事情,不使用对象的方法和属性。
import matplotlib.pyplot as plt

plt.figure(1)                # the first figure
plt.subplot(211)             # the first subplot in the first figure
plt.plot([1, 2, 3])
plt.subplot(212)             # the second subplot in the first figure
plt.plot([4, 5, 6])


plt.figure(2)                # a second figure
plt.plot([4, 5, 6])          # creates a subplot(111) by default

plt.figure(1)                # figure 1 current; subplot(212) still current
plt.subplot(211)             # make subplot(211) in figure1 current
plt.title('Easy as 1, 2, 3') # subplot 211 title

plt.show()
次一级:面向对象的界面的第一层。此时,plt模块的函数仅仅用于创建figure,axes等对象,然后就直接用对象的接口做事情。
x = np.arange(0, 10, 0.2)
y = np.sin(x)
fig, ax = plt.subplots()
ax.plot(x, y)  # 使用ax的方法做事情
plt.show()
对象
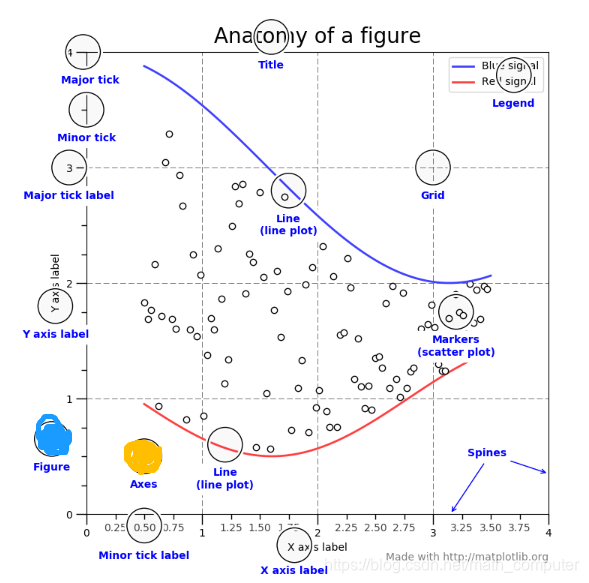
figure
一个figure包含多个axes,也可以一个也没有
- 多个figure,多个axes
import matplotlib.pyplot as plt

plt.figure(1)                # the first figure
plt.subplot(211)             # the first subplot in the first figure
plt.plot([1, 2, 3])
plt.subplot(212)             # the second subplot in the first figure
plt.plot([4, 5, 6])


plt.figure(2)                # a second figure
plt.plot([4, 5, 6])          # creates a subplot(111) by default

plt.figure(1)                # figure 1 current; subplot(212) still current
plt.subplot(211)             # make subplot(211) in figure1 current
plt.title('Easy as 1, 2, 3') # subplot 211 title

plt.show()
- 一个figure,没有axes
fig = plt.figure()  # an empty figure with no axes
fig.suptitle('No axes on this figure')  # Add a title so we know which it is
# plt.plot([1,2,3])  # draw a line (now have an axes)
# plt.show()  # show the plot
axes
一个axes对象构件中有多个axis对象(2D plot有两个,分别是x轴和y轴;3D plot有三个)
import matplotlib.pyplot as plt
x = np.arange(0, 10, 0.2)
y = np.sin(x)
fig, ax = plt.subplots()
fig.suptitle("basic math")
ax.plot(x, y, label='sin')  # 使用ax的方法做事情
ax.set_title('sin function')
ax.set_xlabel('x')
ax.set_ylabel('y')
ax.set_xlim(-1, 11)
ax.legend()
plt.show()
数据
最好是np.array数据,pd和np.matrix的可以进行下面的转换
a = pandas.DataFrame(np.random.rand(4,5), columns = list('abcde'))
a_asarray = a.values

b = np.matrix([[1,2],[3,4]])
b_asarray = np.asarray(b)
mpl, plt和pylab
matplotlib是一个package,pyplot是matplotlib下的一个module ,pylab集合了pyplot和numpy构成统一的命名空间(已被弃用)。
对于plt而言,里面的函数总会有一个当前figure和当前axes(自动创建出来)
x = np.linspace(0, 2, 100)

plt.plot(x, x, label='linear')
plt.plot(x, x**2, label='quadratic')
plt.plot(x, x**3, label='cubic')

plt.xlabel('x label')
plt.ylabel('y label')

plt.title("Simple Plot")

plt.legend()

plt.show()
代码风格
- 显式导入plt和np再利用,而不要全部导入其中的对象,避免污染命名空间
- 使用plt创建出figure和axes对象,然后使用对象的方法进行进一步的控制
- 使用np做数据
- 使用plt显示图像
# 导入方式
import matplotlib.pyplot as plt
import numpy as np

def my_plotter(ax, data1, data2, param_dict):
    """
    A helper function to make a graph

    Parameters
    ----------
    ax : Axes
        The axes to draw to

    data1 : array
       The x data

    data2 : array
       The y data

    param_dict : dict
       Dictionary of kwargs to pass to ax.plot

    Returns
    -------
    out : list
        list of artists added
    """
    out = ax.plot(data1, data2, **param_dict) # 使用对象操作
    return out

# which you would then use as:

data1, data2, data3, data4 = np.random.randn(4, 100) # 数据
fig, (ax1, ax2) = plt.subplots(1, 2) # 获取figure和axes对象
my_plotter(ax1, data1, data2, {'marker': 'x'})
my_plotter(ax2, data3, data4, {'marker': 'o'})
plt.show()
后端
交互式后端和非交互式后端
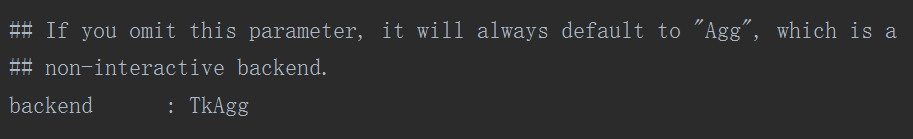
指定后端
- matplotlibrc文件中的backend参数(我的电脑,这个文件位于
C:\Users\xxxx\PycharmProjects\untitled1\venv\Lib\site-packages\matplotlib\mpl-data下)
- 脚本中指定
import matplotlib
matplotlib.use('PS')   # generate postscript output by default
此时如果脚本中有plt.show()也不会显示图片,而会报出UserWarning:

- 环境变量指定(这种没有具体例子)
性能上的考虑
主要是简化render,包括线段、标记等等,可以直接使用fast模式来简单设定
import matplotlib.style as mplstyle
mplstyle.use('fast')
