“岑夫子,丹丘生.将进酒,杯莫停”
给柱状图设置渐变色,效果如下:
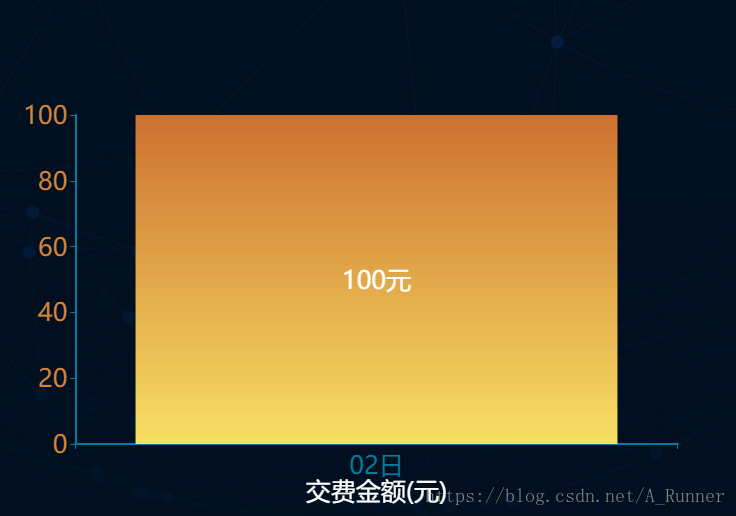
设置代码如下:
series: [
            {
                name: '',
                type: 'bar',
                data: data.seriesList,
                 itemStyle: {
                  normal: {
                  //设置渐变色
                    color: new echarts.graphic.LinearGradient(
                      0, 0, 0, 1,
                    [
                       {offset: 0, color: '#e6584c'},
                        {offset: 1, color: '#f18a82'}
                    ])
                    }
                }
            }
        ]