一、scatter3()方法显示
代码虽然简单,但是举一反三,效果就不一样
x=[4229042.63 4230585.02 4231384.96 4231773.63 4233028.58 4233296.71 4235869.68 4236288.29];
y=[431695.4 441585.8 432745.6 436933.7 428734.4 431946.3 428705.0 432999.5];
z=[1.019 1.023 1.011 1.022 1.020 1.022 1.022 1.023];

scatter3(x,y,z)
运行效果图
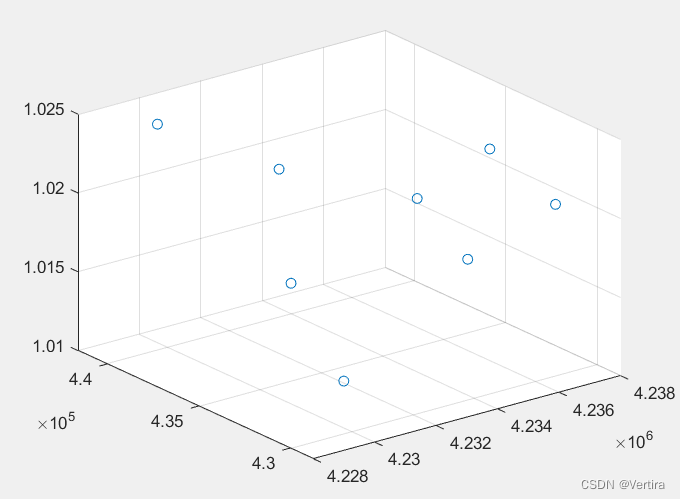
注:x,y,z必须是等长度的数对(即三个等长的矢量)
二、plot3方法显示
clc
clear
close all

x=[4229042.63 4230585.02 4231384.96 4231773.63 4233028.58 4233296.71 4235869.68 4236288.29];
y=[431695.4 441585.8 432745.6 436933.7 428734.4 431946.3 428705.0 432999.5];
z=[1.019 1.023 1.011 1.022 1.020 1.022 1.022 1.023];
plot3(x,y,z,'b.','MarkerSize',5);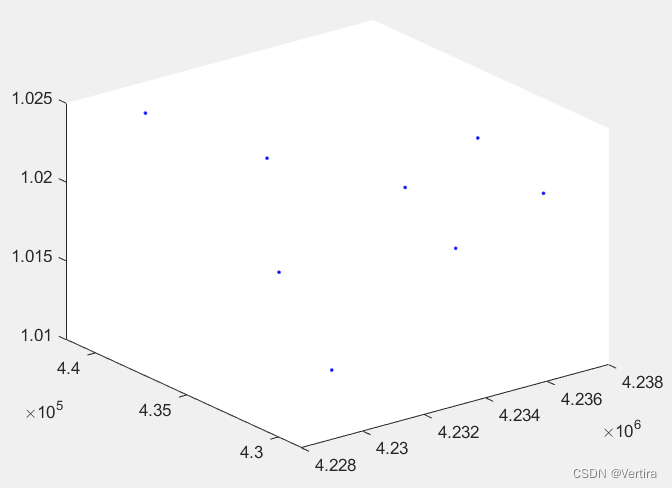
欢迎点赞收藏 加关注
参考链接