2018 China's total electricity consumption and electricity demand analysis and forecasting [map]
http://www.chyxx.com/industry/201804/632710.html
First, the total electricity consumption significantly improved, an increase of 6.6%
First, continue to optimize the structure of the electricity sector, the contribution of the secondary industry demand growth of 60%
Total electricity consumption growth rate rebounded significantly. 2017, total electricity consumption reached 6.3077 trillion kwh, an increase of 6.6% growth rate over the last year to enhance the 1.7 percentage points. Total electricity consumption rebounded mainly four reasons: First, the overall macroeconomic steady for the better, a key indicator of industrial added value, infrastructure construction, foreign trade export growth picked up; the second is to the good steady industrial production, industrial products supply and demand improved significantly, significantly enhance business efficiency, capacity utilization continued to rise, stimulating industrial electricity warmer; Third, the service industry continued to maintain a rapid growth, new formats, new models, new industries are emerging, new momentum gradually foster new electricity consumption growth points; fourth is significantly higher summer temperatures in most areas, in July 2017, the national average temperature in September over the same period have reached the highest since 1961, driving the rapid growth in electricity consumption.
Sub-sector, the primary, secondary and tertiary industries and residential electricity consumption 115.5 billion kwh, respectively, 4.4413 trillion kwh, 881.4 billion kwh and 869.5 billion kwh, respectively, an increase of 7.3%, 5.5%, 10.7% and 7.8%. Electricity consumption growth decomposition shows that the contribution of the secondary sector growth in total electricity consumption up to 60%, followed by the tertiary industry and residential sector, 22% and 16%, respectively.
Sub-quarter view, the growth rate of electricity consumption in 2017 four quarters of 6.9%, 5.7%, 7.8% and 5.8%, respectively, of which the third quarter year on year growth rate of electricity consumption and are at the highest level in the fourth quarter of electricity growth rate decreased significantly, mainly affected by the fourth quarter of 2016, high electricity base, environmental protection and regional northern limit production and other factors.
Sub-sector electricity consumption and electrification rate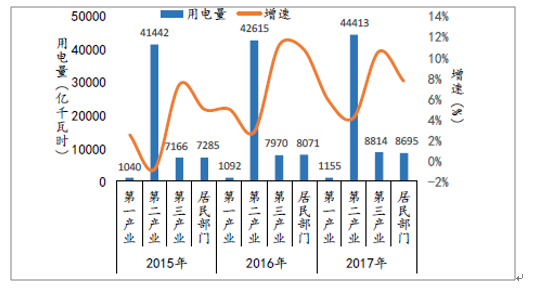
Source: Public data compilation
Related Report: Chilean Research Advisory Network released " 2018--2024 China's power equipment market analysis and forecasting trends research report "
Quarterly and cumulative growth rate of electricity consumption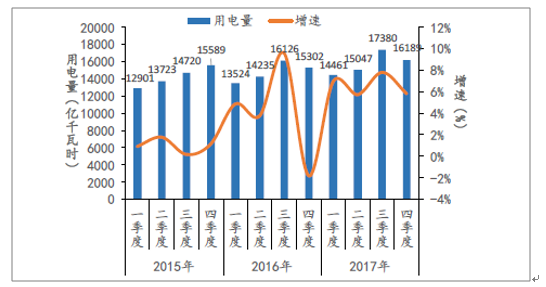
Source: Public data compilation
Second, the total industrial electricity consumption 4.3624 trillion kwh, an increase of 5.5%
2017 total industrial electricity consumption 4.3624 trillion kwh, an increase of 5.5%, the proportion of the total electricity consumption of nearly 70%. 2017, iron and steel, nonferrous metals, chemicals, building materials and other four major energy-intensive industries in total 1.819 trillion kwh of electricity, accounting for about 40% of electricity consumption in the industrial sector, an increase of 1.7%. By supply-side reform and increase the impact of investment in real estate, steel and building materials industry rebounded consumption growth over the previous year, while the chemical and non-ferrous industry, consumption growth has declined. Other manufacturing and electricity consumption growth rate was significantly higher than other industrial sectors.
2017 heavy power 3.6131 trillion kwh, an increase of 5.2%, the growth rate increased 2.7 percentage points over the previous year growth; light industrial electricity 749.3 billion kwh, an increase of 7.0%. Heavy industry occupies a lighter look at the proportion of electricity consumption, electricity consumption accounted for 57.3% of heavy industry, light industry electricity consumption accounted for 11.9%, 2.6 percentage points increase over the previous year.
Industrial subsectors electricity consumption and growth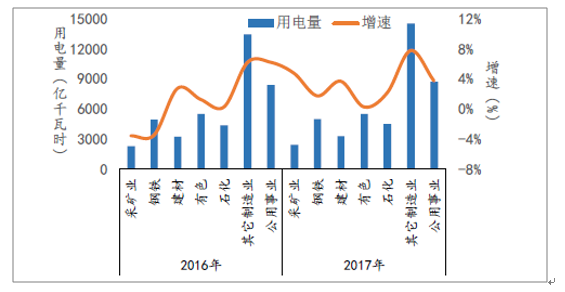
Source: Public data compilation
Jan-Feb Mar Apr May June July 8 Sep Oct Nov Dec rate (%) with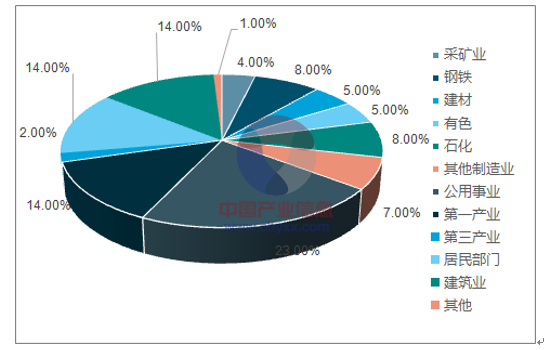
Source: Public data compilation
Heavy growth and accumulation of electricity
Source: Public data compilation
Growth rate and cumulative electric light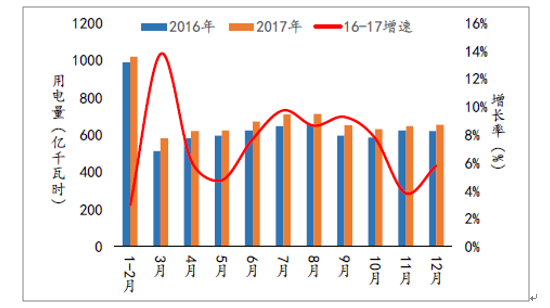
Source: Public data compilation
2017 total electricity consumption of the top five provinces were Guangdong (595.9 billion kwh), Jiangsu (580.8 billion kwh), Shandong (543 billion kwh), Zhejiang (419.3 billion kwh) and Hebei (344.2 billion kWh). Regional electricity the entire society to achieve positive volume growth in varying degrees, in which year growth rate than the national average (6.6%) of the 15 provinces, as follows: Tibet (18.2%), Xinjiang (11.5%), Guizhou ( 11.5%), Inner Mongolia (11.0%), Shanxi (10.8%), Ningxia (10.3%), Shaanxi (9.5%), Jiangxi (9.4%), Gansu (9.3%), Yunnan (9.0%), Zhejiang (8.2% ), Qinghai (7.8%), Chongqing (7.3%), Fujian (7.3%), Anhui (7.0%).
Provincial electricity consumption (one hundred million kwh)
Source: Public data compilation
Monthly electricity consumption (one hundred million kwh)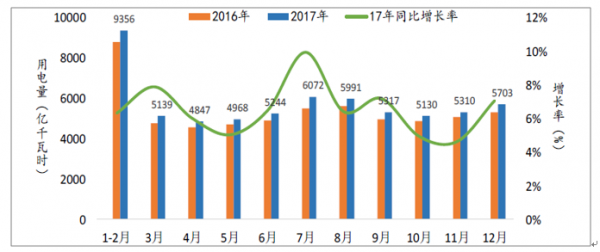
Source: Public data compilation
二、2018年电力需求保持景气,同比增长5.44%
我国的用电需求与经济增长高度相关。“十三五”期间,经济发展步入新常态,经济增长的增速、结构、动力等发生深刻变化,并对电力市场发展产生深远影响。经与宏观团队沟通,判断,从2017年下半年开始,许多长周期的下降力量已经或者正在结束,例如房地产的长期存货去化进入尾声,去产能带来企业盈利能力已经开始底部反弹,全球经济活动开始出现明显改善的势头,人民币实际有效汇率水平得到一定修复,卖地收入的恢复和PPP项目的推广使得政府部门的投资活动摆脱了过去几年的低迷局面,政府换届对经济活动也许存在刺激性影响。尽管内外环境还存在诸多不确定性,但考虑到上述因素,经济即将走出长周期景气下降过程的前景仍然值得期待。预计2018-2020年我国GDP增速分别为6.8%、6.6%和6.5%。根据GDP增速的预测,采用电力弹性系数法对全社会用电需求做出预测。预计2018-2020年,我国用电需求增速分别为5.44%、4.95%和4.68%,对应全社会用电量66508亿千瓦时、69801亿千瓦时和73067亿千瓦时。
2000-2020年全社会用电量(亿千瓦时)
资料来源:公开资料整理
2000-2020年全社会用电量用电量增速(%)
资料来源:公开资料整理
2000-2020年全社会用电量弹性系数(%)
资料来源:公开资料整理
|
|
全社会用电量(亿千瓦时)
|
用电量增速(
%)
|
GDP增速(
%)
|
弹性系数(
%)
|
|
2000A
|
13466
|
11.4%
|
8.5%
|
1.34
|
|
2001A
|
14683
|
9.0%
|
8.3%
|
1.08
|
|
2002A
|
16386
|
11.6%
|
9.1%
|
1.27
|
|
2003A
|
18894
|
15.3%
|
10.0%
|
1.52
|
|
2004A
|
21761
|
15.2%
|
10.1%
|
1.50
|
|
2005A
|
24,779
|
13.9%
|
11.4%
|
1.22
|
|
2006A
|
28,248
|
14.0%
|
12.7%
|
1.10
|
|
2007A
|
32,458
|
14.9%
|
14.2%
|
1.05
|
|
2008A
|
34,268
|
5.6%
|
9.7%
|
0.58
|
|
2009A
|
36,595
|
6.8%
|
9.4%
|
0.72
|
|
2010A
|
41,999
|
14.8%
|
10.6%
|
1.39
|
|
2011A
|
47,026
|
12.0%
|
9.5%
|
1.25
|
|
2012A
|
49,657
|
5.6%
|
7.9%
|
0.71
|
|
2013A
|
53,225
|
7.2%
|
7.8%
|
0.93
|
|
2014A
|
55,213
|
3.7%
|
7.3%
|
0.51
|
|
2015A
|
55,500
|
0.5%
|
6.9%
|
0.08
|
|
2016A
|
59,198
|
6.7%
|
6.7%
|
1.00
|
|
2017A
|
63,077
|
6.6%
|
6.9%
|
0.97
|
|
2018E
|
66,508
|
5.44%
|
6.8%
|
0.80
|
|
2019E
|
69,801
|
4.95%
|
6.6%
|
0.75
|
|
2020E
|
73,067
|
4.68%
|
6.5%
|
0.72
|