
Calculation report
PVC index daily PVC multi-factor-------------------------------
| name | all transactions | long | short |
|---|---|---|---|
| report generation time | 2017/03/11 21:33:00 | ||
| Amount of funds allocated | 500000 | ||
| data contract | PVC Index | ||
| trading contract | PVC Index | ||
| K line cycle | day line | ||
| Data start time | 2009-5-25 | ||
| data end time | 2017-3-10 | ||
| Signal calculation start time | 2009-5-25 | ||
| Signal calculation end time | 2017-3-10 | ||
| unit | 5 (ton/lot, yuan/point) | ||
| Margin | 8.00% | ||
| handling fee | 0.00 yuan/hand | ||
| slippage | 0 | ||
| Open lot | 1 | ||
| Initial capital ratio | 0.66% | ||
| Model | PVC multi-factor | ||
| parameter | [0,0,0,0,0,0] | ||
| name | all transactions | long | short |
| test days | 2847 | ||
| number of test cycles | 1895 | ||
| number of signals | 56 | ||
| total number of instructions | 56 | ||
| Number of signal disappearances | 0 | ||
| Amount of funds allocated | 500000 | ||
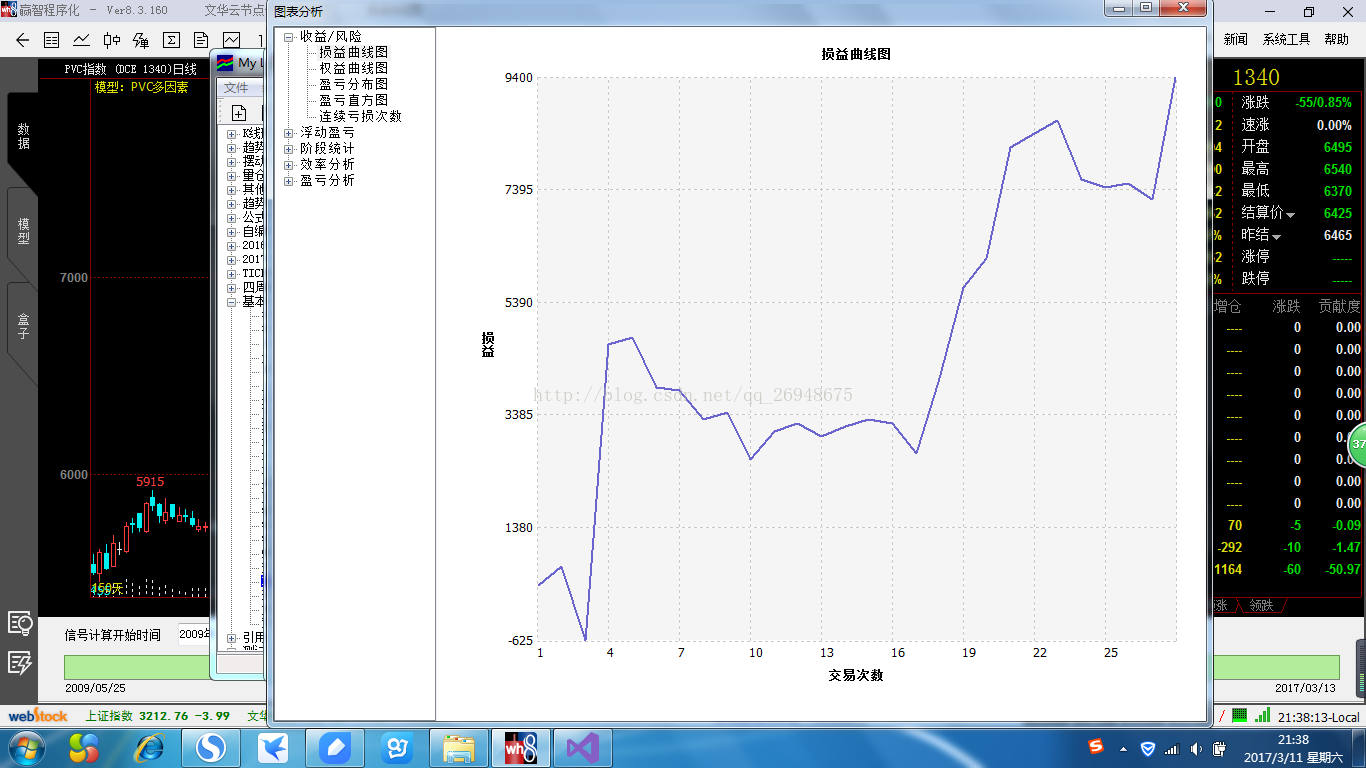
| final interest | 509400 | ||
| Number of short positions | 1398 | ||
| The longest continuous short position period | 455 | ||
| longest trading cycle | 71 | ||
| standard deviation | 1248.10 | ||
| standard deviation | 371.77% | ||
| Sharpe ratio | -14.09 | ||
| Average profit and loss/average loss | 0.62 | ||
| Equity maximum drawdown | 4210.00 | ||
| Equity maximum drawdown time | 2012/09/14 | ||
| Equity maximum drawdown ratio | 0.83% | ||
| Equity maximum drawdown ratio time | 2012/09/14 | ||
| The longest period of equity without a new high | 574 | ||
| The longest period of equity without a new high | 2011/10/20 - 2014/03/07 | ||
| Profit and loss maximum drawdown | 2185.00 | ||
| Profit and loss maximum drawdown time | 2012/09/18 | ||
| Profit and loss maximum drawdown ratio | 0.43% | ||
| Profit and loss maximum drawdown ratio time | 2012/09/18 | ||
| The longest period of profit and loss without a new high | 452 | ||
| The longest period of profit and loss without a new high | 2011/12/22 - 2013/11/12 | ||
| Risk rate | 0.22% | ||
| rate of return/risk | 1.11 | ||
| Maximum loss per lot | 1300.00 | ||
| Average profit and loss per lot | 335.71 | ||
| Profitability | 1.88% | 0.00% | 1.88% |
| Annualized Simple Interest Yield | 0.24% | ||
| Monthly Simple Interest Yield | 0.02% | ||
| Annual compounded rate of return | 0.24% | ||
| monthly compounded rate of return | 0.02% | ||
| win rate | 60.71% | ||
| model score | 62 points | ||
| Average profit/equity maximum drawdown | 0.21 | ||
| Average profit/average loss | 1.67 | ∞ | 1.67 |
| Average Profit Rate / Average Loss Rate | 1.68 | ||
| net profit | 9400 | 0 | 9400 |
| total profit | 15325.00 | 0.00 | 15325.00 |
| total loss | 5925.00 | 0.00 | 5925.00 |
| Total Profit/Total Loss | 2.59 | ∞ | 2.59 |
| Among them, the positions are floating profit | 0.00 | 0.00 | 0.00 |
| number of transactions | 28 | 0 | 28 |
| Profit ratio | 60.71% | 0.00% | 60.71% |
| Profits | 17 | 0 | 17 |
| Number of losses | 11 | 0 | 11 |
| Number of flats | 0 | 0 | 0 |
| Average trading cycle | 67.68 | 0.00 | 67.68 |
| Average Profitable Trading Cycle | 111.47 | 0.00 | 111.47 |
| 平均亏损交易周期 | 172.27 | 0.00 | 172.27 |
| 平均盈亏(利润) | 335.71 | 0.00 | 335.71 |
| 平均盈利 | 901.47 | 0.00 | 901.47 |
| 平均亏损 | 538.64 | 0.00 | 538.64 |
| 最大盈利 | 5270.00 | 0.00 | 5270.00 |
| 最大亏损 | 1300.00 | 0.00 | 1300.00 |
| 最大盈利/总盈利 | 0.34 | ∞ | 0.34 |
| 最大亏损/总亏损 | 0.22 | ∞ | 0.22 |
| 净利润/最大亏损 | 7.23 | ∞ | 7.23 |
| 最大盈利时间 | 2011/11/16 | -- | 2011/11/16 |
| 最大亏损时间 | 2011/08/03 | -- | 2011/08/03 |
| 最大持续盈利次数 | 6 | 0 | 6 |
| 最大持续盈利次数出现时间 | 2013/11/13 - 2015/02/06 | ||
| 最大持续亏损次数 | 3 | 0 | 3 |
| 最大持续亏损次数出现时间 | 2012/02/08 - 2012/06/18 | ||
| 平均持仓手数 | 1 | ||
| 最大持仓手数 | 1 | ||
| 平均使用资金额 | 2596.24 | ||
| 最大使用资金额 | 3294.80 | ||
| 平均资金使用率 | 0.51% | ||
| 最大资金使用率 | 0.66% | ||
| 扣除最大盈利后收益率 | 0.83% | 0.00% | 0.83% |
| 扣除最大亏损后收益率 | 2.14% | 0.00% | 2.14% |
| 期间最大权益 | 510100 | ||
| 期间最小权益 | 498910 | ||
| 手续费 | 0 | ||
| 滑点损耗 | 0 | ||
| 成交额 | 1805470 | ||