Text/Emma Z
The earth is round, but the world is flat.
——"Globalization: The World is Flat" by Thomas L. Friedman
1. The trade route behind a cultural relic
Over the weekend, I visited a museum. One of the exhibitions was Egyptian mummies, including masks, coffin boxes, coffin lids, etc. After a tour, the historical clues hidden behind the cultural relics - the upstream and downstream supply chains were even more exciting and interesting . Shock.
When archaeologists trace and restore the entire supply chain network of ancient Egypt (Ptolemaic Dynasty) through chemical testing , we can clearly imagine the bustling import and export trade of ancient Egypt. see picture 1.

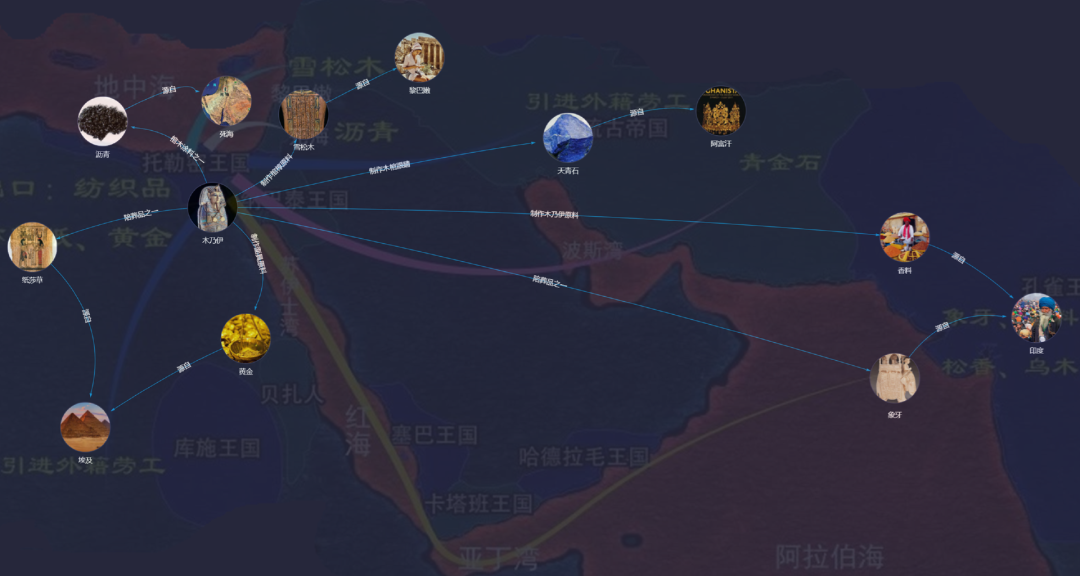
As shown in the picture, the gold used to make the mummies comes from Egypt , the cedar wood used for the coffin is imported from Lebanon , the black asphalt smeared on the coffin lid comes from the Dead Sea , the lapis lazuli used to make the eyes comes from Afghanistan , and the antiseptic material used for the mummies Various spices, etc., come from as far away as India ...
From ancient times to the present, supply chains have been changing our lives, Parag Khanna said in his best-selling book "Super Map-Global Supply Chains, Supermarkets and the Rise of a New Business Civilization" :
We have entered the era of super territory , which is no longer bounded by national borders, but through a globalized supply chain system.
In fact, we have experienced such changes consciously or unconsciously in our daily lives, including the interconnection of materials, transportation and infrastructure, and information. Remote working is also a form of information supply chain—an invisible hand is dominating the development of the world. .
If you look closely at each link in the supply chain, you can see how these small transactions combine to affect global development trends - what Adam Smith called the free market, David Ricardo called The comparative advantage of the Chinese language and Emile Turgan's division of labor theory are all reflected - capital, labor and production flow around the world, flowing to places that can most effectively connect supply and demand!
2. The cornerstone of smart supply chain —data processing capabilities
From the traditional supply chain perspective, the supply chain is a complete ecosystem composed of producers, middlemen and sellers. However, with the development of science and technology, all links that constitute the supply chain ecology, such as planning, procurement, production, warehousing, logistics, and sales, are all composed of data at the bottom layer. In other words, supply chain issues The essence is the problem of data! Moreover, the supply chain is not a linear structure, but a huge topological network - each link contains intricate relationships. So, how can enterprises go through cycles and be able to understand changes, prepare for responses, respond quickly, and act scientifically?
In the modern intelligent supply chain, graph computing (graph database¹ ) has a wide range of application scenarios, from production, maintenance, production planning and scheduling, to material management and inventory management, and its application can be seen in every field. plays an important role.
· Supplier relationship management: Companies can use graphs to manage supplier relationship networks. By storing supplier, product, purchase order and other data as nodes² and edges³ , enterprises can visualize and analyze supplier relationships, thereby helping enterprises identify and deal with risks and opportunities in the supply chain.
· Inventory optimization: Businesses can use graphs to analyze data such as inventory levels, order quantities, and lead times. Identify excess inventory and out-of-stock risks, and optimize inventory by optimizing orders, adjusting production plans, etc.
· Logistics management: Enterprises can use graphs to manage logistics networks. By storing data such as logistics nodes, routes, and transportation tools as nodes and edges, companies can visualize and analyze logistics networks, thereby helping companies identify logistics risks and optimize transportation plans.
· Product quality management: Enterprises can use graph databases to manage product quality data. By storing data such as products, suppliers, and raw materials as nodes and edges, it helps companies identify product quality problems and optimize quality management processes.
……
So, what kind of graph computing (graph database) technology can have efficient data integration and powerful data processing capabilities?
Computing power : high concurrency and real-time computing power that can understand the butterfly effect
We are increasingly aware that no risk exists in isolation. Different risks have chain effects of mutual transformation, transmission and correlation... In the past two or three years, various factors such as natural disasters, wars, and politics have led to Various gray rhino and black swan incidents occur frequently. Take the Russia-Ukraine conflict as an example. In addition to a series of negative impacts, it is also the "culprit" that caused the parts supply crisis for established car companies such as Audi and BMW - many century-old car companies were forced to suspend production and work - Any Butterfly Flapping the wings may cause another connection.
Insight into the butterfly effect and graph computing technology are essentially the same. Ultipa Graph XAI can support more than 30 layers of in-depth search, query and calculation in complex atlases - atlases with hundreds of billions of data. It can achieve ultra-deep real-time penetration of data sets of any magnitude, helping enterprises Or organizations can gain real-time insight into all the hidden, subtle, and complex relationships in the data ocean, enabling early detection, early preparation, and early prevention of risk control management.
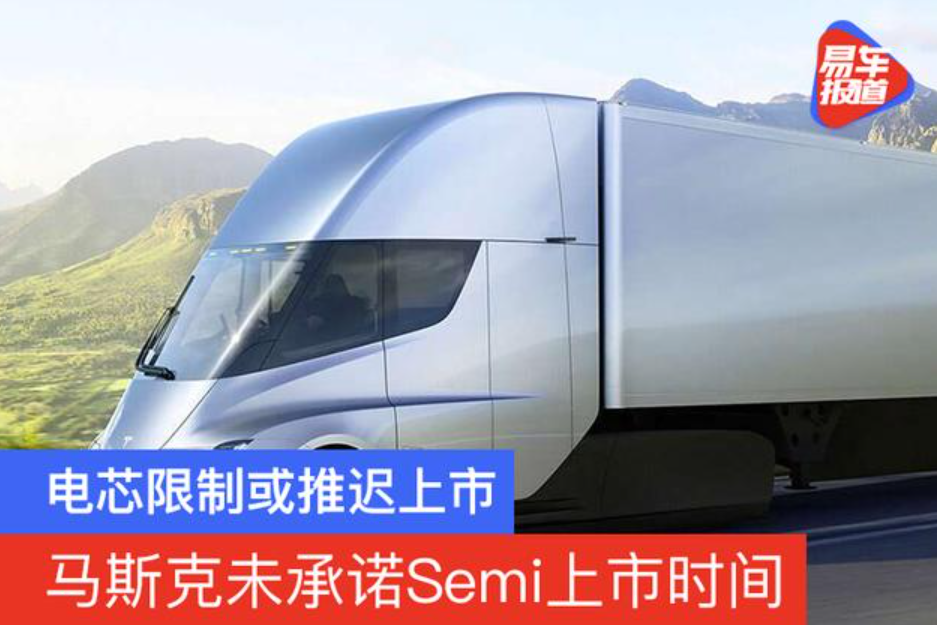
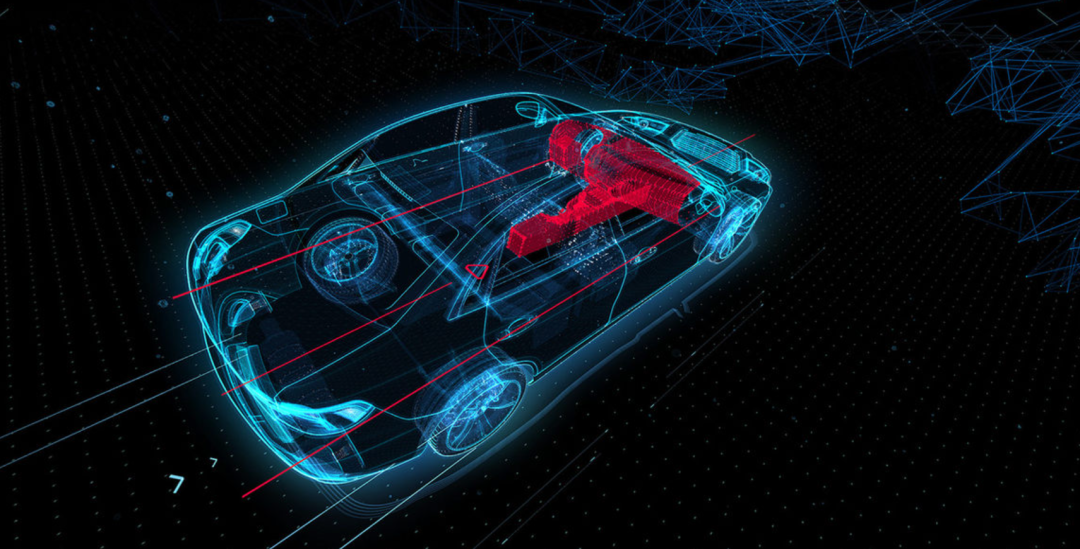
Taking Tesla as an example, the production of a car requires about 10,000 parts, from the power system, central control system, electric drive system, charging system, to chassis, body, interior, exterior... Parts and components, large and small, are provided by thousands of companies, including numerous suppliers, manufacturers, distributors, retailers... They constitute multiple stages of the upstream and downstream supply and delivery processes. A small accident may cause Musk's delivery commitment to be ruined.
Algorithms : 100+ high-performance scalable graph algorithm packages
In our daily life and work, the interactions between people, people and things, and things and things are all inseparable from the word "computing". In this context, algorithms make their debut. Simply put, an algorithm is a specific calculation method and processing steps of limited length taken to solve a certain problem. Generally speaking, there are two types of outputs of algorithms. The first is the results produced by the algorithm (grouping, classification, predicted values, etc.), and the second is the rules produced by the algorithm.
As far as the supply chain is concerned, although it is ubiquitous, the supply chain itself is invisible and intangible. People can only see those elements that connect supply and demand. This also leads to the fact that although the supply chain will be far apart, all parties can see it. They are connected together, but people in different business directions, including production, procurement, logistics, warehousing, raw materials, etc., all have different data, and the data granularity is completely different, which also makes it difficult for everyone to work on the same To communicate in different dimensions, it is even more impossible to achieve real-time (first time) sharing of various information to achieve business insights.
Take procurement as an example. The procurement of large-volume auto parts has always been a top priority for car companies, but this link will involve product category, quantity determination, supplier selection, cost accounting, cost reduction analysis, etc. It is something that requires a lot of manpower, energy, time and efficiency.

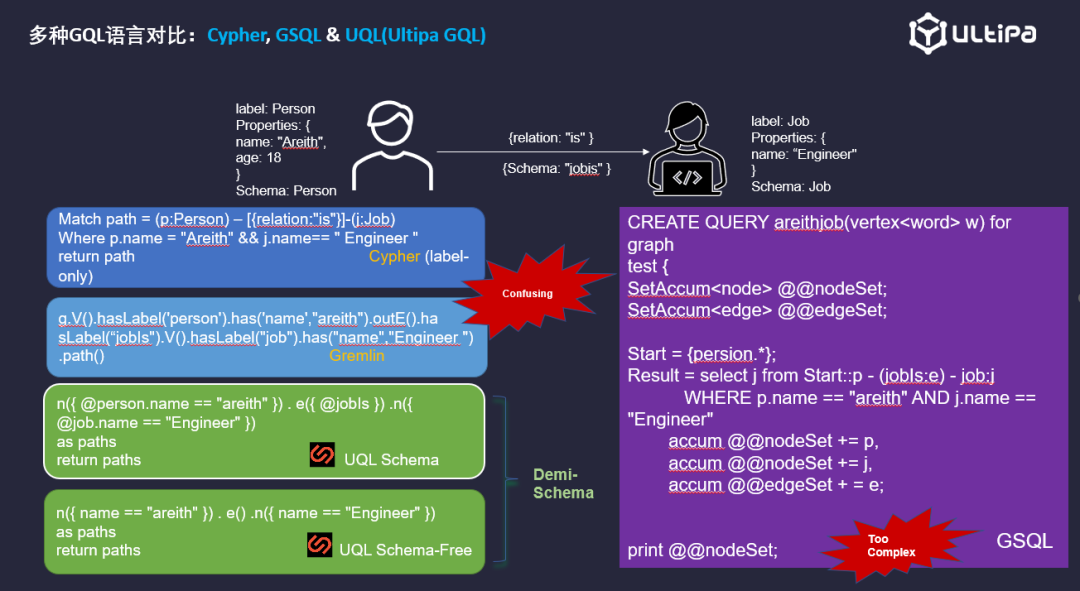
As shown in the table above, Ultipa Graph XAI integrates data from different data sources and uses hundreds of ultra-high-performance graph algorithms (Ultipa has the richest graph algorithm library in the world, with more than 100 kinds). Algorithm, and then through Ultipa GQL (UQL) that supports flexible Demi-schema, in-depth query of data in each link can help car companies integrate the needs of various production lines located around the world, quickly assess the rationality of demand based on budgets, and accurately calculate procurement costs. , to achieve a scientific and transparent procurement process.
For example, if the price of a fixed brand frequently purchased by a production line suddenly rises due to some reason, Ultipa Graph will automatically recommend cheaper and higher-quality alternative brands to ensure the optimal allocation of resources and maximize operational efficiency.
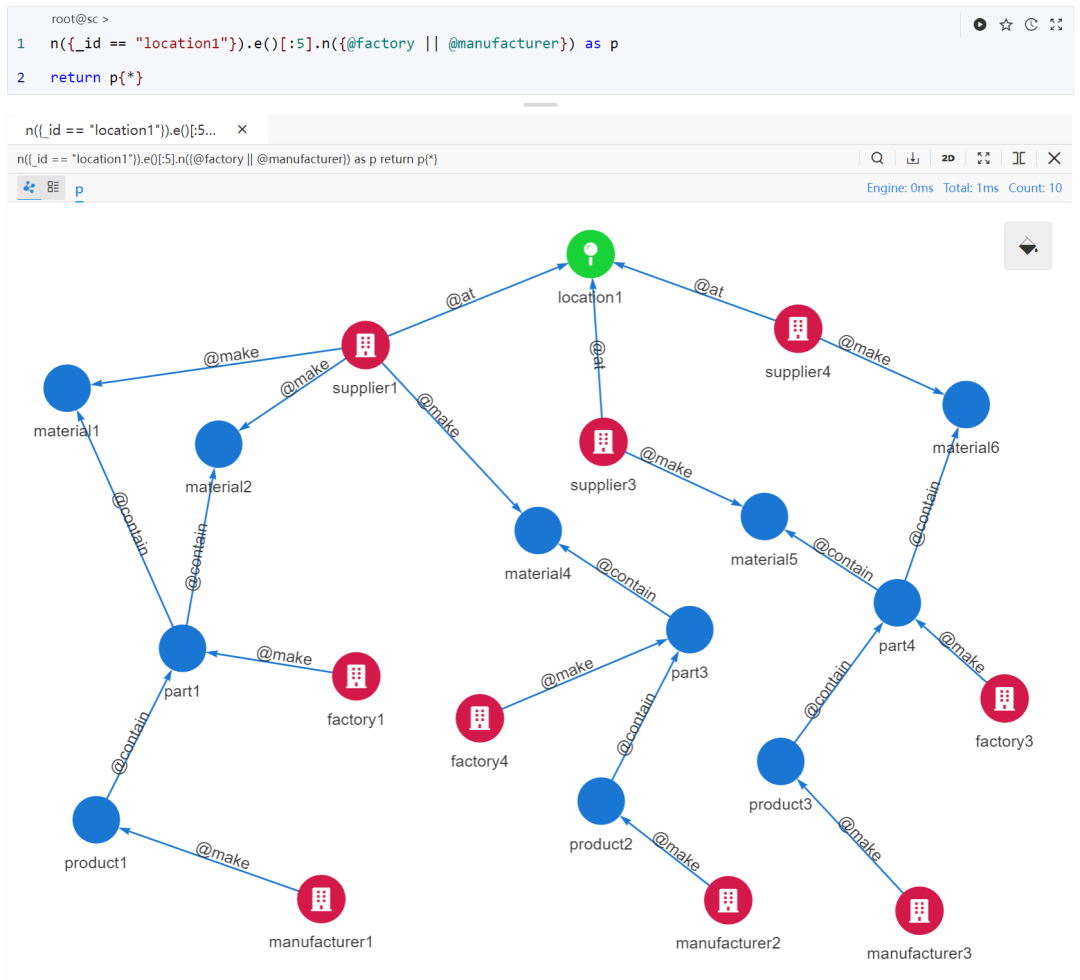
As shown in the figure above, this path template searches all 5-step paths starting from location1 and ending at the factory node or manufacturer node. Therefore, enterprises can easily identify the path and associated impacts caused by a certain risk point in advance, and intelligently carry out optimal matching.
It is worth mentioning that different algorithms for the same problem will have performance differences during runtime. A good algorithm design, in addition to being able to solve the problem, should also have as little computational workload as possible (the highest operating efficiency) , The smaller the required memory space, the better (the least resource consumption). The support of Ultipa algorithm package is currently the most comprehensive, most efficient and lowest-latency option in the world.
More importantly, Ultipa's algorithm design is an enhanced XAI function that can draw nutrients from the continuous repetition of the same tasks and become more clear, simple and effective. At the same time, different algorithms have also joined forces to carry out combination optimization and focus on processing problems that are difficult to solve with a single algorithm, such as the data of autonomous driving algorithms, such as visual algorithms. In the end, the competition is still the data set of the training model, which was originally expected to be reduced in the short term. The impossible becomes possible.
Calculation (data) : The high dimensionality of the graph restores the world 100%
Technically speaking, all industries around the world are facing the challenges and opportunities of digital transformation. The technical nature of digital transformation is the challenge of transforming from traditional relational databases to big data, fast data, and then to deep data (linked data, graph data).
Today, in the face of ubiquitous computing, various scenarios will involve a large amount of data calculation and processing, such as IoT devices in workshops and smart homes in daily life scenarios. Every time they run for 1 second, a large amount of data will be generated—— These massive and complex data are like mineral deposits and need to be collected, stored, mined and analyzed.
However, due to the limitations of its model, traditional relational databases are not capable of meeting the storage, query, and calculation requirements . See below.

In traditional relational databases, when multi-table association queries are involved, the amount of calculation increases in proportion to the Cartesian product of the amount of data in the table. The larger the amount of data, the more table associations, the more complex, and the lower the efficiency; while graph databases The calculation logic adopted is the nearest neighbor association calculation (query) mode, which has low calculation complexity and exponential improvement in efficiency. (Interested readers can read in detail: The difference between graph databases and relational databases )

When we use relational databases and graph databases respectively for deep penetration, from layers 2 to 5, the performance difference actually increases exponentially. For example, when doing layer 1 penetration, there may be no essential difference between the two. Starting from layer 2, there will be exponential (more than 10 times) changes. It can no longer return any results, that is to say, it has exceeded the computing scope of the machine and has stopped. (Interested readers can read in detail: How is a high-concurrency graph database system implemented? )
It is worth mentioning that not all graph databases can achieve deep penetration. Some graph databases only have storage capabilities but lack computing capabilities. Some can calculate, but are very inefficient when it comes to data migration. (Interested readers can refer to: Does graph database only count? ) There are also some graph databases that are implemented using NoSQL or MapReduce architectures, but they have not fully and deeply optimized the characteristics of graph computing. The final effect is The more horizontal the distribution, the lower the efficiency. What's more, blindly moving all data into the memory will cause a sudden increase in memory usage, which will also cause negative problems such as frequent OOM and resulting in downtime.
The correct implementation path is " distribution + storage and computing integration + multi-level storage optimization + graph query depth optimization ". There are many knowledge points and challenges involved in graph databases, about how to design and implement a truly high-performance distributed graph. Database, interested readers can refer to How to implement a high-concurrency graph database system? .
The Ultipa distributed HTAP graph database provides a new option for this challenge and will work with the Internet of Things and digital twins to build the digital infrastructure of the smart supply chain.
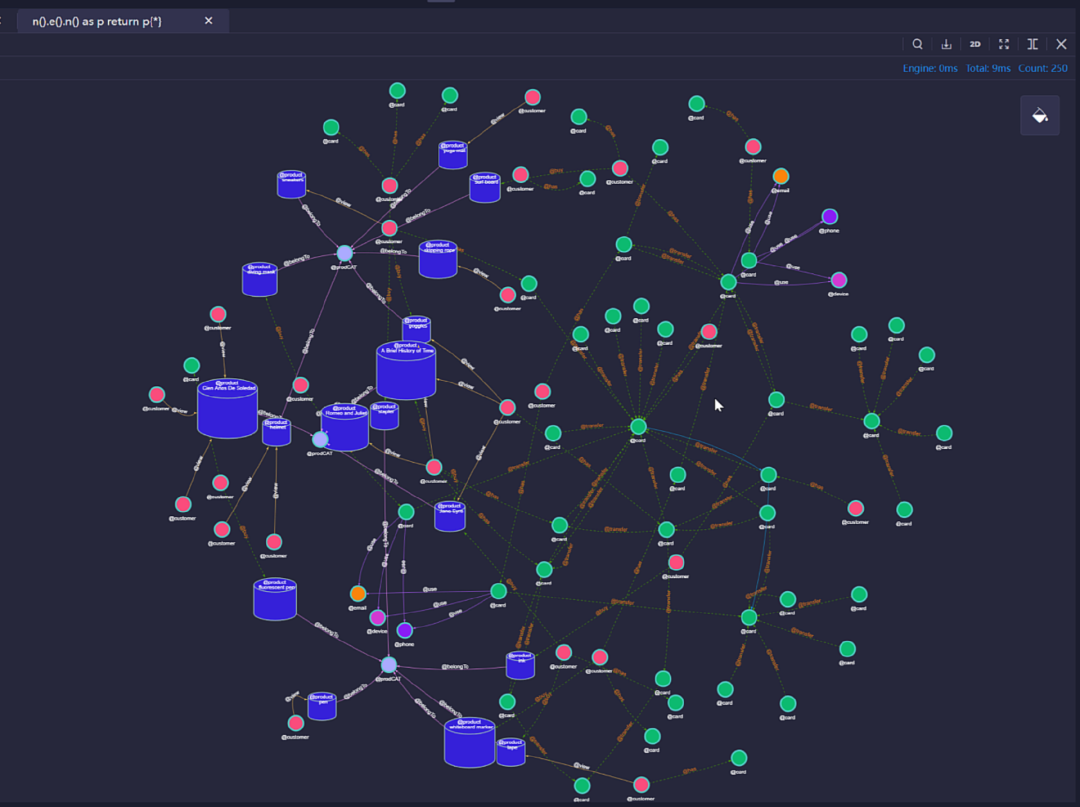
In addition, enterprises can coordinate and automate the management process through the pull of Ultipa's underlying engine, through Ultipa manager (interested readers can refer to the high-visualization series of articles on Ultipa Manager ) or combined with the visual interface developed by the enterprise's customized upper layer. .

Enterprises can reflect real information in real time through their own customized maps, allowing everyone to grasp the progress of the situation and the correlation between data at any time, and integrate customers, manufacturers, and suppliers across separation into a tight whole...
Conclusion
Marx said that productivity determines production relations.
Artificial intelligence, Internet of Things, cloud computing... With the rapid changes in the field of science and technology, the flow of information and materials has reached unprecedented levels. More and more companies are participating in the global economic cycle. The productivity gap that has spanned centuries between the East and the West is growing. Being filled in quickly, the world seems to be really being wiped out...
However, we have also seen the other side of the coin - in the complex logic that constitutes the world, the "Dell Theory" is not effective, and the Thucydides Trap will exist for a long time. Because as long as we look at history as a mirror, we will find that wars between two countries in the supply chain are actually the norm. Much like the early 20th century, the UK was known as the empire on which the sun never sets. Although its exports accounted for 13% of the world's GDP, it still It failed to prevent the outbreak of World War I, which was as close as the war between Russia and Ukraine... Is the world flat? The connections in the supply chain are so fragile... But no matter what, the data insights provided by graph computing (graph database) technology will be the life-saving straw that empowers companies and organizations to control their risks.
At the end of the article, we would like to thank Ultipa Sr. Content Strategist Wanyi.S, Peipei.C, and lina.S for their contribution to this article.

[1] Graph database https://www.ultipa.cn/document/ultipa-graph-query-language/basic-concepts/v4.0
[2] What is point https://www.ultipa.cn/document/ultipa-graph-query-language/basic-concepts/v4.0
[3] What is an edge https://www.ultipa.cn/document/ultipa-graph-query-language/basic-concepts/v4.0
{4] "Graph Database Principles, Architecture and Applications"; Sun Yuxi, Yingtu Team; 2022-8; Machinery Industry Press.
" Graph Database Principles, Architecture and Applications " is the first domestic monograph that comprehensively and systematically explains graph database and graph computing technology . The whole book focuses on eight major dimensions to help technology enthusiasts, practitioners, and college teachers and students quickly gain entry, understanding, and practical guidance on graph database technology.
Enterprises can reflect real information in real time through their own customized maps, allowing everyone to grasp the progress of the situation and the correlation between data at any time, and integrate customers, manufacturers, and suppliers across separation into a tight whole...
Conclusion
Marx said that productivity determines production relations.
Artificial intelligence, Internet of Things, cloud computing... With the rapid changes in the field of science and technology, the flow of information and materials has reached unprecedented levels. More and more companies are participating in the global economic cycle. The productivity gap that has spanned centuries between the East and the West is growing. Being filled in quickly, the world seems to be really being wiped out...
However, we have also seen the other side of the coin - in the complex logic that constitutes the world, the "Dell Theory" is not effective, and the Thucydides Trap will exist for a long time. Because as long as we look at history as a mirror, we will find that wars between two countries in the supply chain are actually the norm. Much like the early 20th century, the UK was known as the empire on which the sun never sets. Although its exports accounted for 13% of the world's GDP, it still It failed to prevent the outbreak of World War I, which was as close as the war between Russia and Ukraine... Is the world flat? The connections in the supply chain are so fragile... But no matter what, the data insights provided by graph computing (graph database) technology will be the life-saving straw that empowers companies and organizations to control their risks.
At the end of the article, we would like to thank Ultipa Sr. Content Strategist Wanyi.S, Peipei.C, and lina.S for their contribution to this article.

[1] Graph database https://www.ultipa.cn/document/ultipa-graph-query-language/basic-concepts/v4.0
[2] What is point https://www.ultipa.cn/document/ultipa-graph-query-language/basic-concepts/v4.0
[3] What is an edge https://www.ultipa.cn/document/ultipa-graph-query-language/basic-concepts/v4.0
{4] "Graph Database Principles, Architecture and Applications"; Sun Yuxi, Yingtu Team; 2022-8; Machinery Industry Press.
"Graph Database Principles, Architecture and Applications" is the first domestic monograph that comprehensively and systematically explains graph database and graph computing technology. The whole book focuses on eight major dimensions to help technology enthusiasts, practitioners, and college teachers and students quickly gain entry, understanding, and practical guidance on graph database technology.
