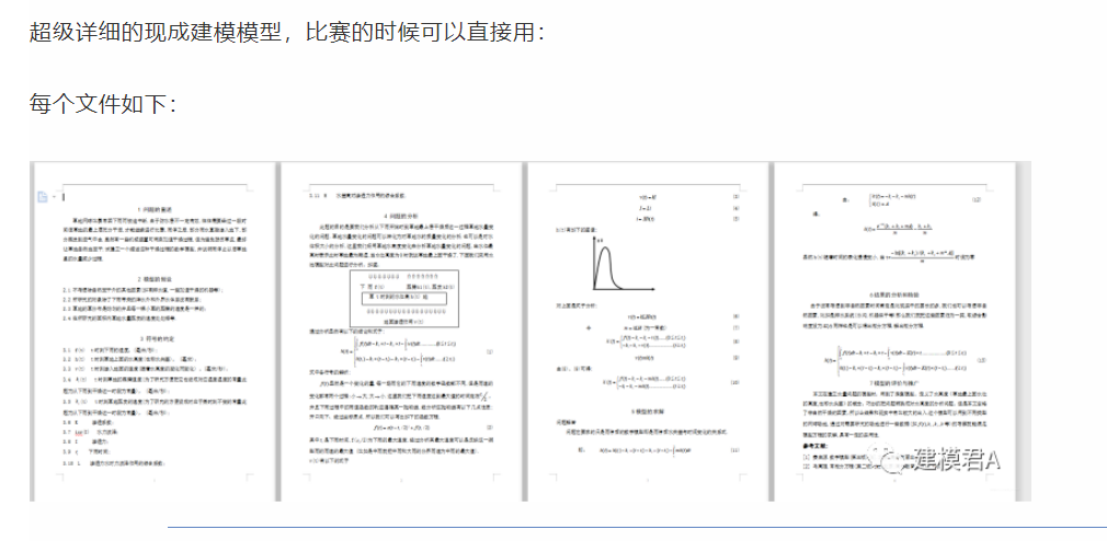
Article directory
0 Question Ideas
(Share on CSDN as soon as the competition questions come out)
https://blog.csdn.net/dc_sinor?type=blog
1 Competition information
The National College Student Mathematical Modeling Competition (hereinafter referred to as the competition) is a mass science and technology activity hosted by the China Society of Industrial and Applied Mathematics for college students across the country. It aims to stimulate students' enthusiasm for learning mathematics, improve students' ability to build mathematical models and use computer technology to solve practical problems. We encourage students to actively participate in extracurricular science and technology activities, expand their knowledge, cultivate their creative spirit and sense of cooperation, and promote the reform of university mathematics teaching system, teaching content and methods.
Competition topics are generally derived from appropriately simplified and processed practical problems in the fields of science and engineering technology, humanities and social sciences (including economic management). Participants are not required to master in-depth professional knowledge in advance. They only need to have studied basic mathematics courses in colleges and universities. . The questions have greater flexibility for contestants to use their creative abilities. Contestants should complete a paper (i.e. answer sheet) that includes the assumptions, establishment and solution of the model, the design and computer implementation of the calculation method, the analysis and testing of the results, and the improvement of the model according to the requirements of the topic. The main criteria for competition awards are the rationality of assumptions, creativity of modeling, correctness of results and clarity of written expression.
The competition is divided into undergraduate and junior college groups. Undergraduate students can only participate in the undergraduate group competition, not the specialist group competition. Junior college (higher vocational college) students generally participate in junior college competitions, but they can also participate in undergraduate competitions. No matter which competition group they participate in, they must be determined at the time of registration. After the registration deadline, the registration group cannot be changed. Students on the same team must be from the same school.
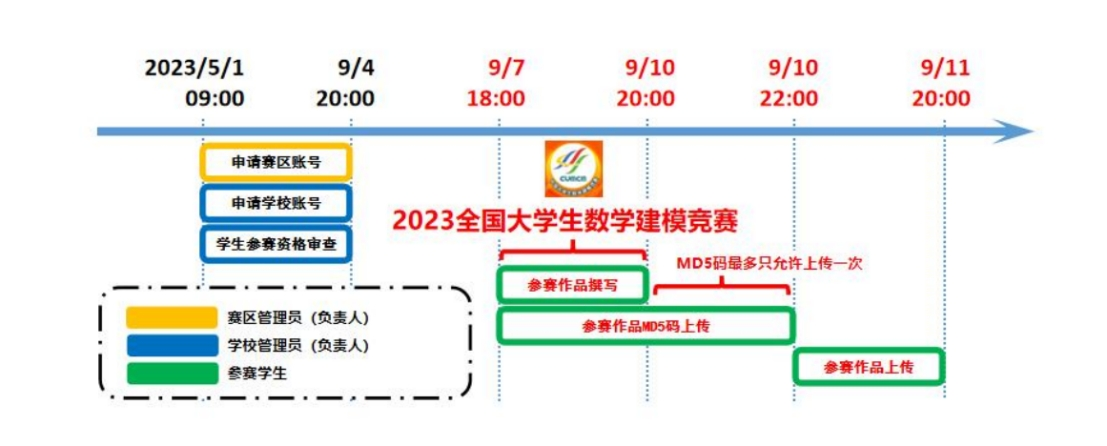
2 Competition time
Registration end time: 20:00 on September 4, 2023
Competition start time: 18:00 on September 7, 2023 (Thursday)
Competition end time: 20:00 on September 10, 2023 (Sunday)
3 Modeling Frequently Asked Question Types
While the competition questions have not been updated yet, Mr. A will summarize the mathematical models commonly used in mathematical modeling in the national competition. The questions basically belong to the following four types of problems, and the corresponding solutions are also given by Mr. A.
They are:
classification model
optimization model
predictive model
Evaluation model
3.1 Classification problem
Discriminant analysis:
Also known as the "discrimination method", it is a multi-variable statistical analysis method that determines the type of a research object based on various characteristic values under the conditions of determined classification.
The basic principle is to establish one or more discriminant functions according to certain discriminant criteria; use a large amount of data on the research object to determine the undetermined coefficients in the discriminant function, and calculate the discriminant index; based on this, it is possible to determine what category a certain sample belongs to. When a new sample data is obtained, it is necessary to determine which category of known types the sample belongs to. This type of problem belongs to the discriminant analysis problem.
Cluster analysis:
Cluster analysis or clustering is to divide similar objects into different groups or more subsets through static classification methods, so that member objects in the same subset have similar attributes, commonly included in the coordinate system shorter spatial distances, etc.
Cluster analysis itself is not a specific algorithm, but a general task that needs to be solved. It can be achieved by different algorithms that vary greatly in terms of understanding what clusters are made of and how to find them efficiently.
Neural network classification:
BP neural network is a neural network learning algorithm. It is a hierarchical neural network composed of an input layer, an intermediate layer, and an output layer. The intermediate layer can be expanded to multiple layers. RBF (Radial Basis Function) neural network: The radial basis function (RBF-Radial Basis Function) neural network is a three-layer feedforward network with a single hidden layer. It simulates the structure of neural networks in the human brain that adjust locally and cover each other's receptive fields. Perceptron neural network: It is a neural network with a single layer of computational neurons, and the transfer function of the network is a linear threshold unit. It is mainly used to simulate the perceptual characteristics of the human brain. Linear neural network: It is a relatively simple neural network, consisting of one or more linear neurons. A linear function is used as the transfer function, so the output can be any value. Self-organizing neural network: Self-organizing neural network includes self-organizing competition network, self-organizing feature mapping network, learning vector quantification and other network structure forms. K nearest neighbor algorithm: K nearest neighbor classification algorithm is a theoretically mature method and one of the simplest machine learning algorithms.
3.2 Optimization problem
Linear programming:
Mathematical theory and method for studying the extreme value problem of linear objective function under linear constraints. English abbreviation LP. It is an important branch of operations research and is widely used in production planning, logistics and transportation, resource allocation, financial investment and other fields. Modeling method: list the constraints and objective function; draw the feasible region represented by the constraints; find the optimal solution and optimal value of the objective function within the feasible region.
Integer programming:
A program in which the variables (wholly or partially) are restricted to integers is called an integer program. If the variables in a linear model are restricted to integers, it is called integer linear programming. The currently popular methods for solving integer programming are often only applicable to integer linear programming. A class of mathematical programming that requires all or some of the variables in the solution of a problem to be integers. From the composition of constraints, it can be subdivided into linear, quadratic and nonlinear integer programming.
Nonlinear programming:
Nonlinear programming is a mathematical programming with nonlinear constraints or objective functions, and is an important branch of operations research. Nonlinear programming studies the extreme value problem of an n-element real function under a set of constraints of equality or inequality, and at least one of the objective function and the constraints is a nonlinear function of an unknown quantity. The case where both the objective function and the constraints are linear functions is called linear programming.
Dynamic programming:
Including knapsack problems, production and operation problems, fund management problems, resource allocation problems, shortest path problems and complex system reliability problems, etc.
Dynamic programming is mainly used to solve optimization problems of dynamic processes divided into stages by time. However, some static programming that has nothing to do with time (such as linear programming and nonlinear programming) can be regarded as a multi-stage decision-making process as long as the time factor is artificially introduced. , can also be easily solved using dynamic programming methods.
Multi-objective planning:
Multi-objective programming is a branch of mathematical programming. Study the optimization of more than one objective function over a given region. Any multi-objective programming problem consists of two basic parts:
(1) More than two objective functions;
(2) Several constraints. There are n decision variables, k objective functions, and m constraint equations, then:
Z=F(X) is a k-dimensional function vector, Φ(X) is an m-dimensional function vector; G is an m-dimensional constant vector;
3.3 Prediction problem
Regression Fit Forecast
Fitting prediction is the process of establishing a model to approximate the actual data sequence, which is suitable for developmental systems. When building a model, it is usually necessary to specify a meaningful time origin and time unit. Moreover, the model should still make sense as t tends to infinity. The significance of studying fitting prediction as a separate system is to emphasize its "image" nature. The establishment of a prediction model must be as consistent as possible with the actual system. This is the principle of fitting. The degree of fitting can be measured by least squares, maximum likelihood, and minimum absolute deviation.
Gray forecast
Gray predictions are predictions made about gray systems. It is a method of predicting systems containing uncertain factors. Gray prediction identifies the degree of dissimilarity in development trends between system factors, that is, performs correlation analysis, and generates and processes original data to find the rules of system changes, generates data sequences with strong regularities, and then establishes corresponding differential equations model to predict the future development trend of things. It constructs a gray prediction model using a series of quantitative values observed at equal intervals that reflect the characteristics of the prediction object, and predicts the characteristic quantity at a certain moment in the future, or the time to reach a certain characteristic quantity.
Markov forecast: It is a method that can be used to forecast the internal human resource supply of an organization. Its basic idea is to find out the rules of personnel changes in the past, so as to predict the trend of future personnel changes. The transformation matrix is actually The transition probability matrix describes the overall form of employee inflow, outflow and internal mobility in the organization, and can be used as the basis for predicting internal labor supply.
BP neural network prediction
BP network (Back-ProPagation Network), also known as back-propagation neural network, continuously corrects the network weights and thresholds through training of sample data to make the error function decrease along the negative gradient direction and approach the expected output. It is a widely used neural network model, mostly used for function approximation, model identification and classification, data compression and time series prediction.
support vector machine method
Support vector machine (SVM), also known as support vector network [1], is a supervised learning model and its related learning algorithms that use classification and regression analysis to analyze data. Given a set of training samples, each training sample is labeled as belonging to one or the other of two categories. The training algorithm of a support vector machine (SVM) creates a model that assigns new samples to one of two categories, making it a non-probabilistic binary linear classifier (although in a probabilistic classification setting, there are things like Prato correction Such methods use support vector machines). The support vector machine model represents samples as mapped points in space, so that samples with a single category can be separated as clearly as possible. All such new samples map to the same space, and their category can be predicted based on which side of the interval they fall on.
3.4 Evaluation Questions
AHP
It refers to taking a complex multi-objective decision-making problem as a system, decomposing the goal into multiple goals or criteria, and then decomposing it into several levels of multiple indicators (or criteria, constraints), and calculating the single-level ranking ( weight) and total ranking as a systematic method for target (multiple indicators) and multi-program optimization decision-making.
Pros and cons solution distance method
Also known as the ideal solution method, it is an effective multi-index evaluation method. This method constructs the positive ideal solution and the negative ideal solution of the evaluation problem, that is, the maximum and minimum values of each indicator, and calculates the relative closeness of each solution to the ideal solution, that is, the distance close to the positive ideal solution and far away from the negative ideal solution. degree, to sort the schemes, so as to select the optimal scheme.
fuzzy comprehensive evaluation method
It is a comprehensive bid evaluation method based on fuzzy mathematics. This comprehensive evaluation method transforms qualitative evaluation into quantitative evaluation based on the membership theory of fuzzy mathematics, that is, using fuzzy mathematics to make an overall evaluation of things or objects that are restricted by multiple factors. It has the characteristics of clear results and strong system. It can solve fuzzy and difficult-to-quantify problems well, and is suitable for solving various non-deterministic problems.
Gray relational analysis method (gray comprehensive evaluation method)
For the factors between two systems, the measure of the magnitude of their correlation with time or different objects is called the degree of correlation. In the process of system development, if the change trends of two factors are consistent, that is, the degree of synchronous change is high, it can be said that the degree of correlation between the two is high; otherwise, the degree of correlation is low. Therefore, the gray correlation analysis method is based on the degree of similarity or dissimilarity in the development trends between factors, that is, the "gray correlation degree", as a method of measuring the degree of correlation between factors.
Canonical correlation analysis method: It is an understanding of the cross-covariance matrix. It is a multivariate statistical analysis method that uses the correlation between pairs of comprehensive variables to reflect the overall correlation between the two groups of indicators. Its basic principle is: in order to grasp the correlation between the two groups of indicators as a whole, two representative comprehensive variables U1 and V1 are extracted from the two groups of variables (respectively, they are the linear coefficients of each variable in the two variable groups). Combination), using the correlation between these two comprehensive variables to reflect the overall correlation between the two sets of indicators.
Principal component analysis (dimensionality reduction)
It is a statistical method. A set of possibly correlated variables is converted into a set of linearly uncorrelated variables through orthogonal transformation. The converted set of variables is called principal components. When using statistical analysis methods to study multi-variable topics, too many variables will increase the complexity of the topic. People naturally hope that the number of variables is smaller and the information obtained is more. In many cases, there is a certain correlation between variables. When there is a certain correlation between two variables, it can be interpreted that there is a certain overlap in the information reflected by the two variables on this topic. Principal component analysis is to delete the repeated variables (closely related variables) for all the variables originally proposed, and create as few new variables as possible, so that these new variables are not correlated in pairs, and these new variables reflect the The information on the topic is kept as original as possible. A statistical method that tries to recombine the original variables into a new set of several unrelated comprehensive variables, and at the same time, according to actual needs, can take out a few smaller comprehensive variables to reflect as much information as possible about the original variables is called principal component analysis or called principal component analysis. Principal component analysis is also a method used in mathematics to reduce dimensionality.
Factor analysis method (dimensionality reduction)
Factor analysis refers to the statistical technique that studies the extraction of common factors from variable groups. It was first proposed by British psychologist CE Spearman. He found that there was a certain correlation between students' scores in various subjects. Students who did well in one subject often had better scores in other subjects, and thus speculated whether there were some potential common factors, or some general intellectual conditions. Affects students' academic performance. Factor analysis can find hidden representative factors among many variables. Grouping variables of the same nature into one factor can reduce the number of variables and test hypotheses about the relationship between variables.
BP neural network comprehensive evaluation method
It is a multi-layer feed-forward network trained by the error back propagation algorithm, and it is one of the most widely used neural network models. The BP network can learn and store a large number of input-output pattern mapping relationships without revealing the mathematical equations describing the mapping relationship in advance. Its learning rule is to use the steepest descent method to continuously adjust the weights and thresholds of the network through backpropagation to minimize the sum of squared errors of the network. The topology structure of BP neural network model includes input layer, hidden layer and output layer.
4 Modeling information
Data Sharing: The Strongest Modeling Data