
1. Background
In time-series data scenarios such as the Internet of Things and the Internet of Vehicles, the high-speed data writing capability is crucial, which will have an impact on the availability, reliability, and scalability of product solutions.
Taking the Internet of Things as an example, when faced with tens of millions or even hundreds of millions of devices, and each device collects dozens to hundreds of indicators on average, the data generated per second will reach billions to tens of billions. Whether data of this magnitude can be inserted in a timely and reliable manner is the core element and the first requirement for evaluating a time-series database.
Therefore, it is particularly important to test the performance of time series databases. TSBS , as an open source testing tool for batch loading performance and query execution performance of time series databases, has been used more and more.
2. Introduction to TSBS
Time Series Benchmark Suite (TSBS) is a benchmark tool written in go language for generating time series datasets, which can benchmark the read and write performance of various time series databases. TSBS is scalable and can perform batch write performance and query execution performance benchmark tests on various time series data scenarios (such as devops, IoT, etc.).
Currently TSBS supports two scenarios of IOT and Devops:
-
IoT Scenario : Simulating data loads in an IoT environment, this use case simulates the flow of data from a fleet of trucks at a fictional trucking company, including diagnostic data and metrics from each truck, and brings in relevant environmental factors such as out -of-order data and batch ingestion (for trucks that have been offline for a while). It also tracks truck metadata and uses it to tie together metrics and diagnostics as part of a queryset.
-
Devops Scenario : The "Development Operations" use case, which comes in two flavors. The full form is used to generate, insert and measure data in 9 "systems" that can be monitored in real devops scenarios (eg, CPU, memory, disk, etc.). Together, these nine systems generate 100 metrics per read interval. Another form focuses only on CPU metrics for simpler, leaner use cases. This use case generates 10 CPU metrics per read. In addition to the metric readings, "tags" (including the host's location, operating system, etc.) are generated for each host in the dataset.
Currently supported databases:
-
Batteries
-
Cassandra
-
ClickHousee
-
CrateDBe
-
InfluxDB
-
MongoDB
-
SiriDBe
-
TimescaleDB
-
VictoriaMetricse
For time-series databases that do not support TSBS, performance testing can be carried out after adapting to the database type.
3. TSBS test tool
1. TSBS Test Tool Installation
( 1) Use go get to download TSBC and its related applications
$ go get github.com/timescale/tsbs
$ cd  /root/go/src/github.com/timescale/tsbs/cmd
$ go get ./...
(2) Switch to cmd and use go install to install some applications
#Install desired binaries. At a minimum this includes tsbs_generate_data,
#tsbs_generate_queries, one tsbs_load_* binary, and one tsbs_run_queries_* binary:
$ cd $GOPATH/src/github.com/timescale/tsbs/cmd
$ cd tsbs_generate_data && go install
$ cd ../tsbs_generate_queries && go install
$ cd ../tsbs_load_timescaledb && go install
$ cd ../tsbs_run_queries_timescaledb && go install
(3) Switch to cmd and use go install for the rest of the installation
#Optionally, install all binaries:
$ cd $GOPATH/src/github.com/timescale/tsbs/cmd
$ go install ./...
2. TSBS test tool use
The TSBS benchmark test is divided into 3 phases: data generation and query language generation, data write/insert test, and query test. The use of the three phases of the TSBS test tool is described below using the IOT scenario and the timescaledb database as examples.
(1) Data generation
Data for benchmarking is generated by TSBS as input to the benchmarking phase. The required variables are as follows:
-
--use-case: Use scenarios, including iot, devops, cpu-only, such as iot;
-
--seed: PRNG seed for deterministic generation. For example: 123;
-
--scale: Number of trucks/equipment to spawn. For example: 50000;
-
--timestamp-start: The start time of the timestamp in the data. For example: 2016-01-01T00:00:00Z;
-
--timestamp-end: The end time of the timestamp in the data. For example: 2016-01-01T00:10:00Z;
-
--log-interval: How long, in seconds, there should be an interval between each read for each device. For example: 10s;
-
--format: The database that needs to be generated, for example: timescaledb.
You can set variables by yourself to generate data files in a custom directory. For example, use the above variables to generate data sets (generate tsdb-data data files in the custom directory /tmp/).
The above example generates a pseudo-CSV file for bulk loading data into TimescaleDB. Each database has its own format for storing data that is easiest for its database's corresponding loader to write to.
(2) Query generation
The required variables are as follows:
-
Same use case, number of trucks, start time as in data generation;
-
--timestamp-end: The end time of one second after the data is generated, for example: for 2016-01-01T00:10:00Z use 2016-01-01T00:10:01Z;
-
--queries: The number of queries for the generated SQL statement, for example: 1000;
-
--query-type: The query type of SQL statement to be generated, for example: "specific-sub-table";
For example: the following is an example of generating a group of timescaledb single-type queries, and other query statement types can be generated by changing the query type --query-type (see the appendix at the end for a complete list of query types):
$ tsbs_generate_queries --use-case="iot" --seed=123 --scale=50000 \
    --timestamp-start="2016-01-01T00:00:00Z" \
    --timestamp-end="2016-01-01T00:10:01Z" \
    --queries=1000 --query-type=" specific-sub-table " --format="timescaledb" \
    --use-additional-tags=false | gzip > /tmp/timescaledb-queries- specific-sub-table.gz
( 3) Data insertion/writing test
TSBS measures insert/write performance by taking the data generated in the previous step and using it as input to a database-specific command-line program. The tsbs_load executable can load data in any supported database. Pre-generated data files can be used as input. Each loader does share some common flags - for example, batch-size (number of reads inserted together), workers (number of clients inserting concurrently), connection details (host and port), etc. To find flags for a specific database, use the -help flag (for example, tsbs_load_timescaledb -help).
For example:
#use insert
$ tsbs_load_timescaledb --postgres="sslmode=disable" --host=172.24.0.2 --port=5432 --pass="inspur123" --user="postgres" --admin-db-name=postgres --workers=1 --in-table-partition-tag=false --field-index-count=0 --do-create-db=true --force-text-format=false --do-abort-on-exist=false --file="/tmp/timescaledb-data" --partitions=1 --use-insert=true --batch-size=8000
#use load
$ tsbs_load_timescaledb --postgres="sslmode=disable" --host=172.24.0.2 --port=5432 --pass="inspur123" --user="postgres" --admin-db-name=postgres --workers=1 --in-table-partition-tag=false --field-index-count=0 --do-create-db=true --force-text-format=false --do-abort-on-exist=false --file="/tmp/timescaledb-data" --partitions=1 --use-insert=false --batch-size=8000
A new database named benchmark will be created in TimescaleDB to store the data. When loading the full dataset all but the last two rows contain data in CSV format with column names in the header. These column names correspond to: timestamp, metrics per second for period, total metrics inserted, overall metrics per second, rows per second for period, total rows, total rows per second. The last two lines insert metrics number (and applicable rows), time and average write rate. You can control the level of parallel loads that run concurrently by changing the value of --workers and the number of partitions by changing the value of --partitions .
(4) Query test
To measure query execution performance in TSBS, you first need to use the previous section to load the data and generate the query as previously described. After loading data and generating queries, you only need to use the corresponding tsbs_run_queries_ binary file for the database being tested, and realize various types of query performance tests by changing the database and the query statement types generated under the corresponding custom directory of the database. The missing conditions can also be queried according to -help.
For example :
For the timescaledb database query "specific-sub-table":
$ cat /tmp/timescaledb-queries- specific-sub-table.gz | \
    gunzip | bin/tsbs_run_queries_timescaledb --workers=1 \
    --hosts=172.24.0.2 --port=5432 --pass=123456 \
    --postgres="user=postgres database=benchmark sslmode=disable"
You can control the level of parallel queries that run concurrently by changing the value of --workers .
4. Practice
1. Test environment

2. Import performance test
The test uses the TSBS test tool to generate the truck data set (about 9.9G) of the trucking company in the IoT scenario, and tests: the import/query performance of TimescaleDB under the partitions of 1, 50, 100, and 150 under works=2;
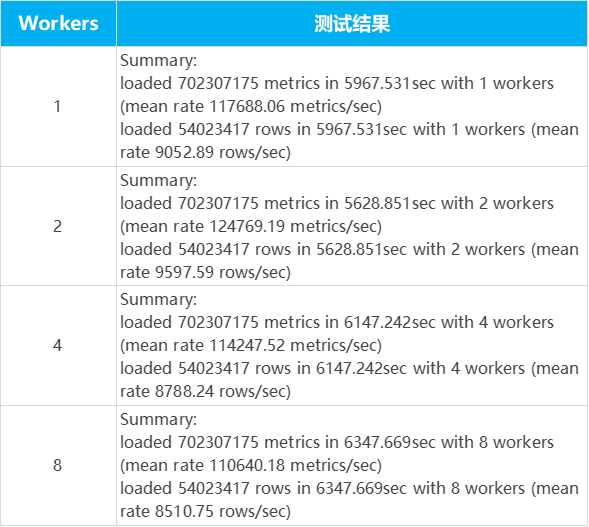
Import/query performance of TimescaleDB with works=1, 2, 4, 8.
Test Results:

TimescaleDB tests different partitions under workers=2, and has the best import performance under partitions=50. Specifically as shown in the figure below:

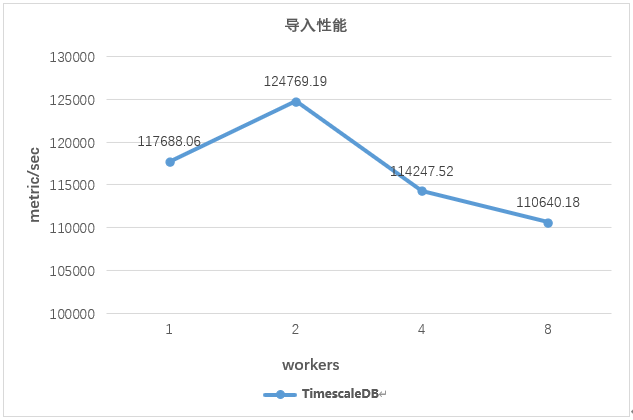
Test the import performance of TimescaleDB under different workers when partitions=50, the import performance of TimescaleD is as follows:
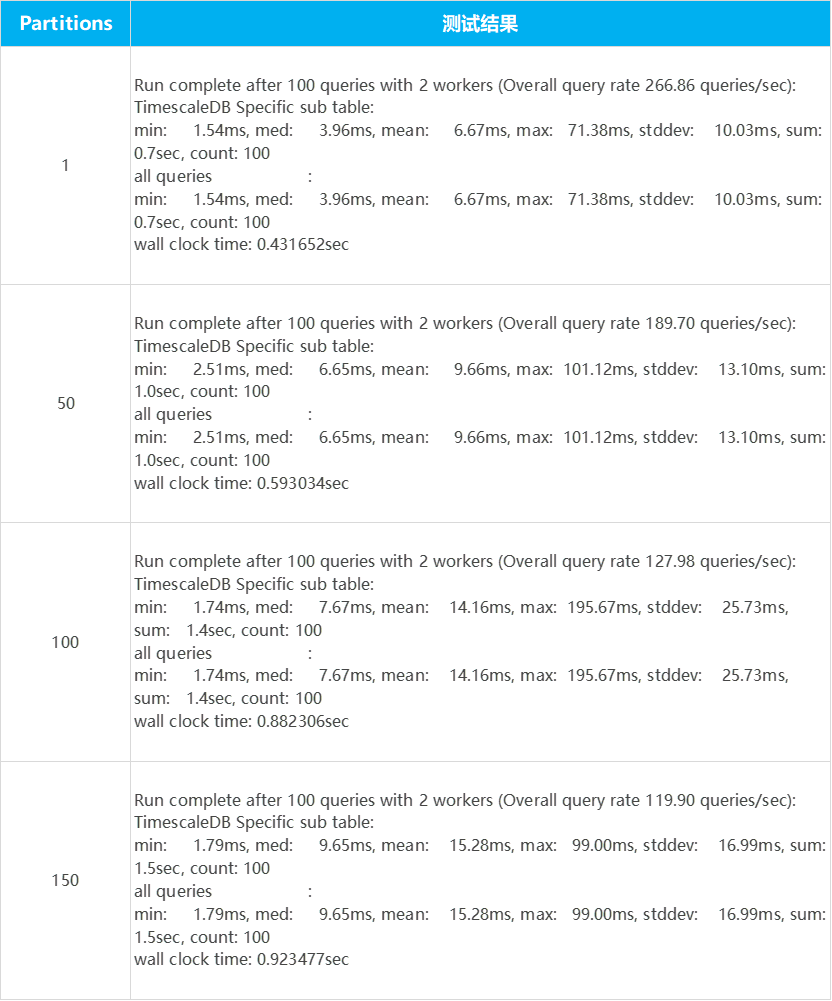
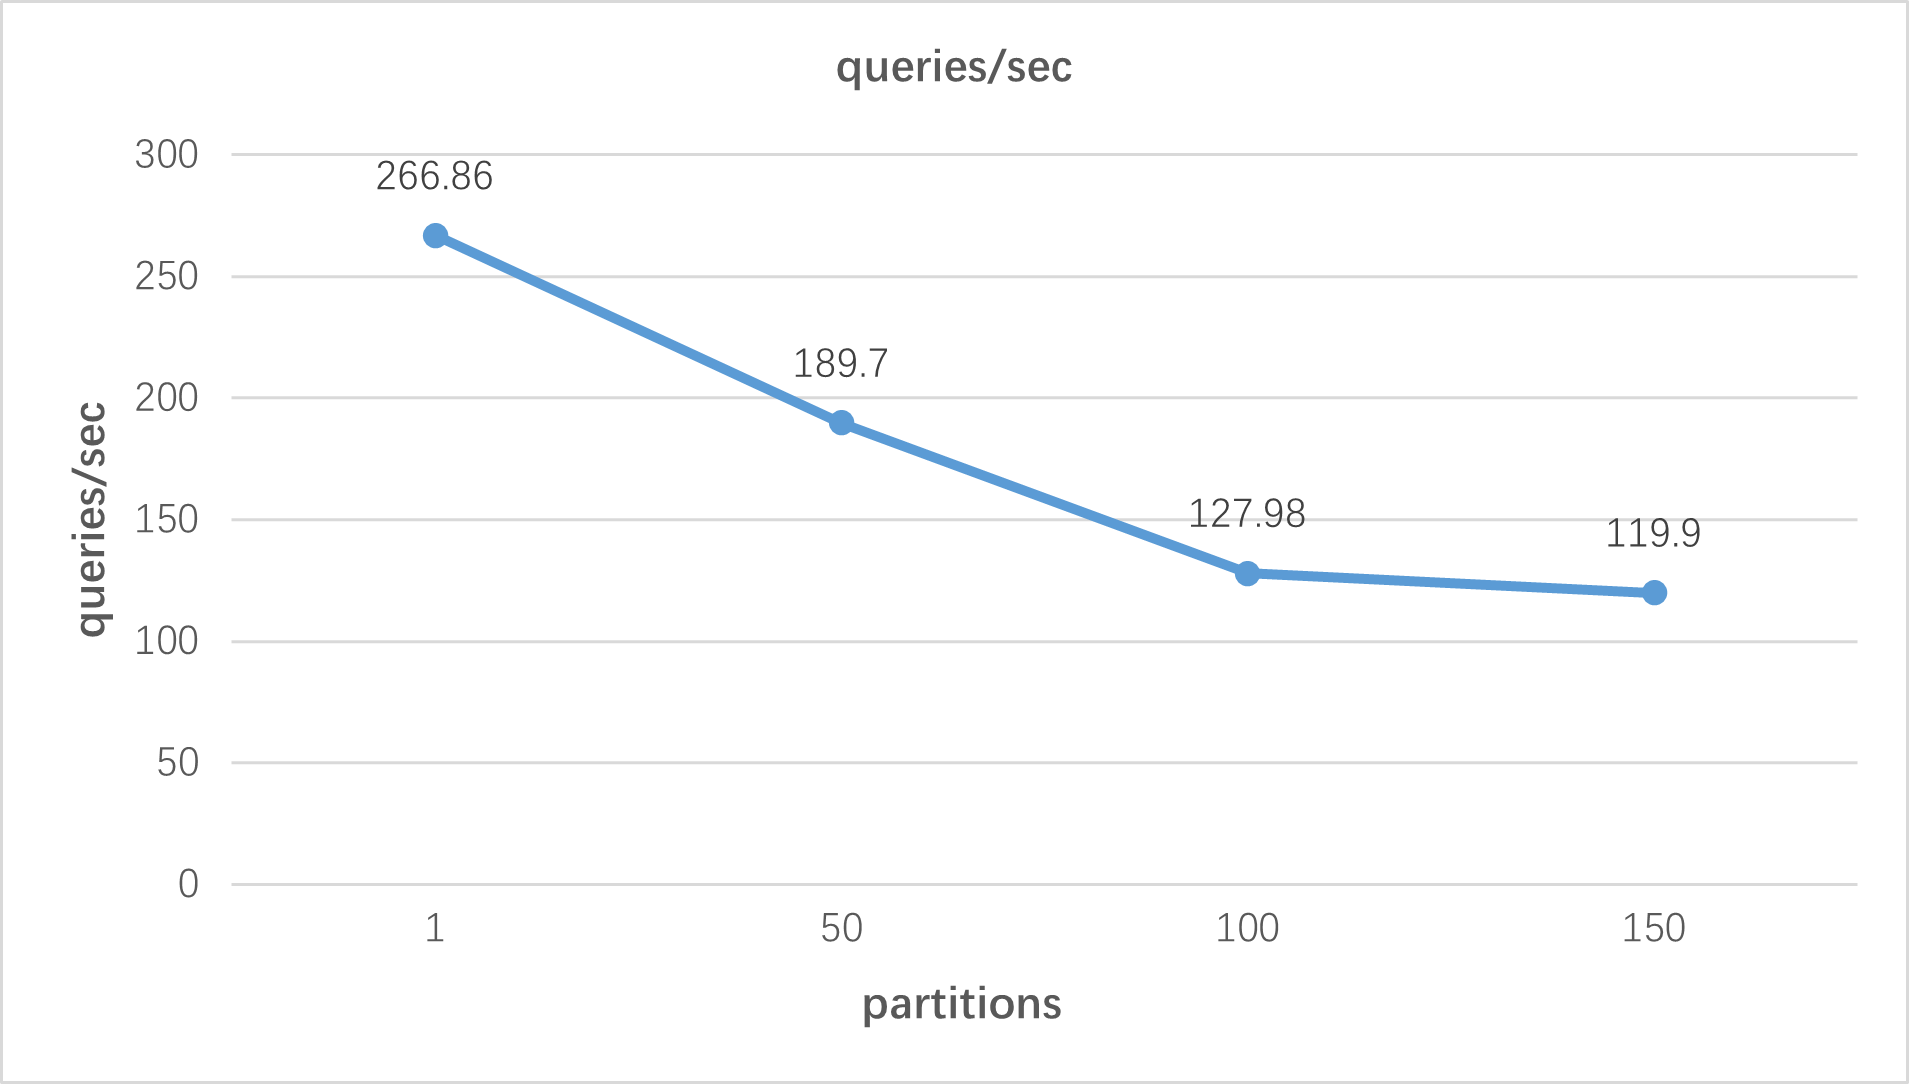
3. Query performance test
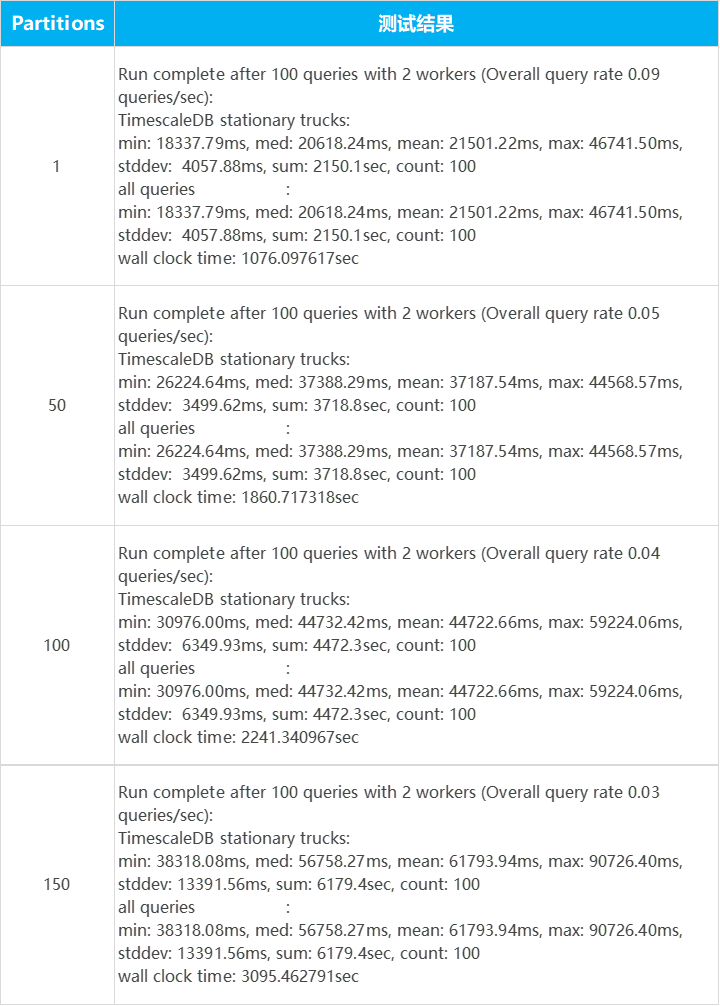
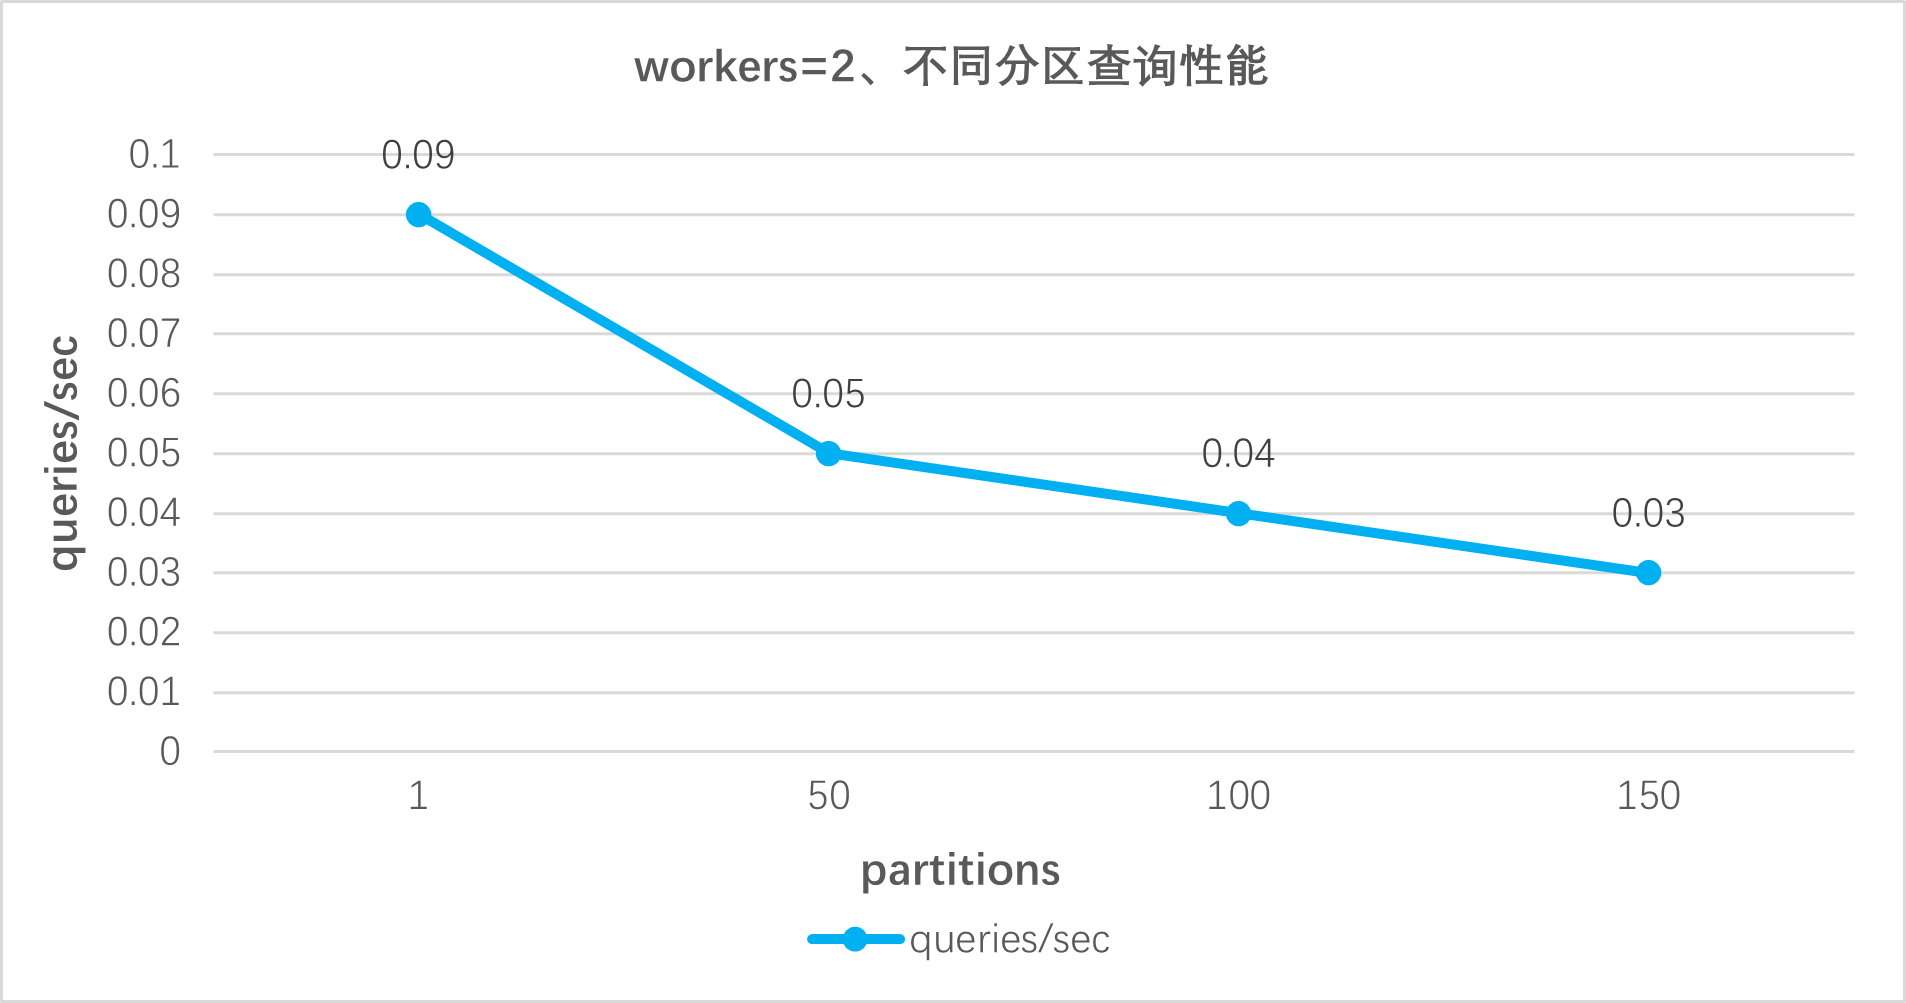
Test workers=2, the query performance of TimescaleDB under different partitions (1, 50, 100, 150);
The query performance of TimescaleDB under different workers (1, 2, 4, 8).
(1) Query statement:
query-specific-sub-table:
SELECT t.driver, r.latitude, r.longitude
FROM tags t
INNER JOIN LATERAL (SELECT latitude, longitude, name FROM readings)
      AS r ON r.name = t.name
WHERE t.name IS NOT NULL
AND t.name = GetRandomName()
query-stationary-trucks-avg-velocity:
SELECT t.name, t.driver, avg(r.velocity) as avg_velocity
FROM tags t
INNER JOIN readings r ON r.name = t.name
WHERE time >= Start()
AND time < End()AND t.name IS NOT NULL
AND t.fleet = GetRandomFleet()
GROUP BY 1, 2
(2) Test results:
query-stationary-trucks-avg-velocity:
specific-sub-table:
5. Query Type
1. Devops/cpu-only
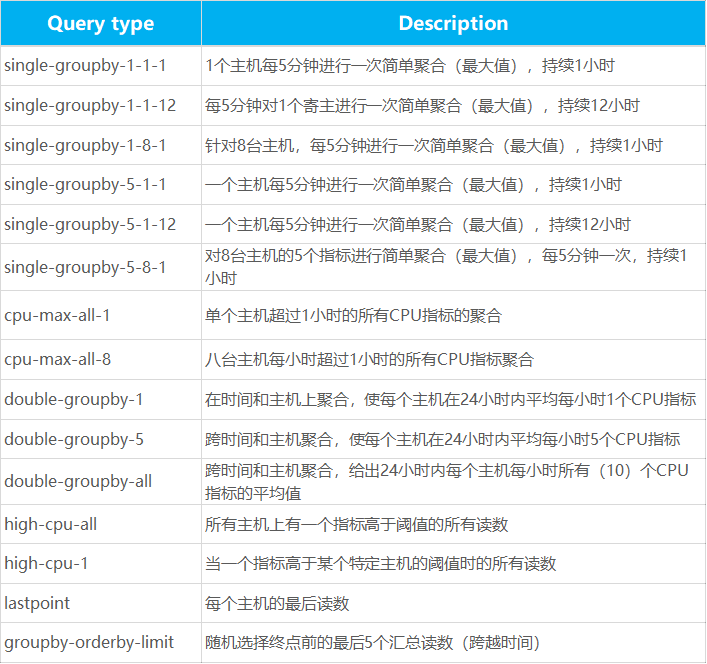
2. IoT
