作地:Alexander Wert , Cesar Munoz

People are doing more and more on their smartphones through private and professional mobile apps. With thousands or even millions of users, ensuring excellent performance and reliability is a major challenge for providers and operators of mobile applications and related backend services. Understanding the behavior of mobile applications, the occurrence and types of crashes, the root causes of slow response times , and the actual impact of backend issues on users is key to managing the performance of mobile applications and related backend services.
Elastic has launched an Application Performance Monitoring (APM) agent for Android applications that allows developers to track key aspects of their applications, from crashes and HTTP requests to screen render times and end-to-end distributed tracing. All of these help to resolve issues and performance deficiencies of mobile applications, corresponding backend services and their interactions. The Elastic APM Android agent automatically detects your application and its dependencies, so you can simply "plug and play" the agent into your application without worrying about making too many changes to your codebase.
The Elastic APM Android agent was developed from the ground up on top of OpenTelemetry, an open standard and observability framework. Developers will be able to take full advantage of its features, as well as the support provided by its large and active community. If you are familiar with OpenTelemetry and your application is already instrumented with OpenTelemetry, then you can simply reuse it when switching to Elastic APM Android Agent. But don't worry if that's not the case - the agent is configured to automatically handle common traceability scenarios without delving into the details of the OpenTelemetry API.
[Related article: Adding Free and Open Elastic APM as part of Elastic Observability Deployment ]
how it works
Elastic APM Android Agent is a combination of SDK and Gradle plugin. The SDK contains utilities that allow you to initialize and configure the behavior of the agent, as well as prepare and initialize the OpenTelemetry SDK. You can use the SDK to configure and initialize agents programmatically, especially for advanced and special use cases.
In most cases, no programmatic configuration and initialization is required. Instead, you can use the provided Gradle plugin to configure the proxy and automatically instrument your application. The Gradle plugin uses Byte Buddy and the official Android Gradle plugin API behind the scenes to automatically inject instrumentation code into your application through compile-time transformations of your application and its dependency classes.
Compiling your application with the Elastic Android APM agent Gradle plugin configured and enabled will enable your Android application to report trace data, metrics, and various events and logs at runtime.
Using the Elastic APM agent in an Android application
With a simple demo application , we will follow the steps mentioned in the " Setting up a proxy " guide to setup the Elastic Android APM proxy.
prerequisites
For this example, you will need the following:
- Elastic Stack with APM enabled (We recommend Elastic's Cloud offering. Free trial.)
- Java 11+
- Android Studio
- Android emulator, AVD device
You'll also need a way to push your application's signals to Elastic. Therefore, you will need the Elastic APM secret token, which you will configure later in our sample application.
Test project for our example
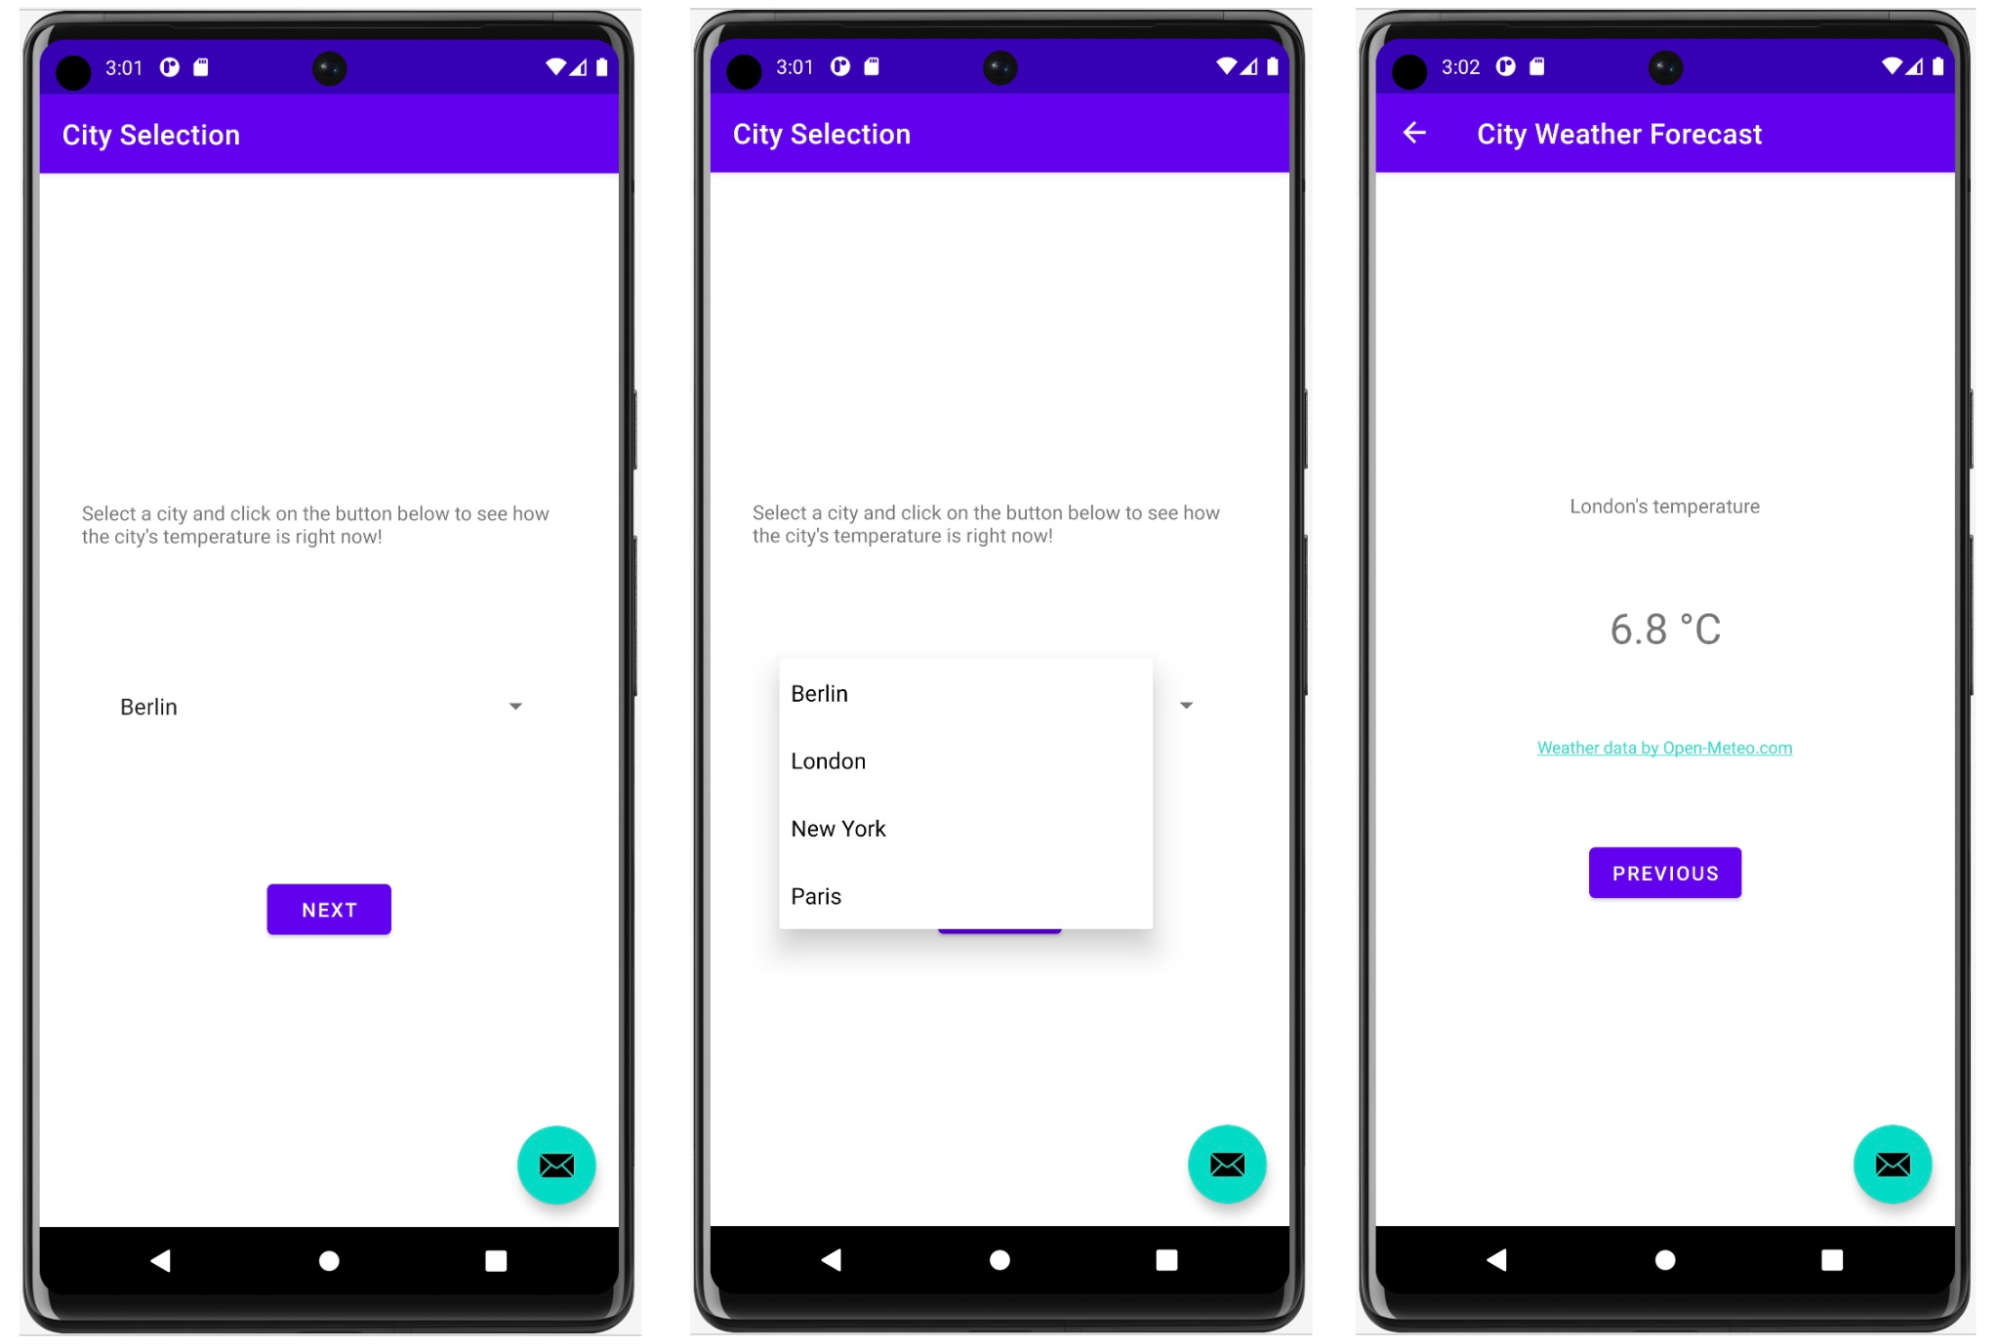
To demonstrate an end-to-end scenario including distributed tracing, in this example we will instrument a simple weather application consisting of two Android UI fragments and a simple native Spring Boot-based backend service.
The first fragment will have a dropdown with some city names and a button that will take you to the second fragment where you will see the current temperature for the selected city. If you select a non-European city on the first screen, you'll get an error from the (local) backend when you go to the second screen. This is to demonstrate how to catch and correlate network and backend errors in Elastic APM.
Apply the Elastic APM agent plugin
In the following, we explain all the steps required to set up the Elastic APM Android agent for an Android application from scratch . If you want to skip these instructions and see the agent in action right away, use the master branch of this repository and apply only step (3.b) before proceeding to the next section (“Setting up a local backend service”).
1. Clone the sample application repository and open it in Android Studio.
2. Switch to the uninstrumented repo branch, starting with a blank, uninstrumented Android application. You can switch to an unchecked branch by running this command:
git checkout uninstrumented3. Follow the setup guide for Elastic APM Android Agent:
Add the co.elastic.apm.android plugin to the app/build.gradle file (make sure to use the latest version of the plugin, you can find it here).
Configure the proxy connection to the Elastic APM backend by providing the "serverUrl" and "secretToken" in the "elasticAPM" section of the app/build.gradle file.
// Android app's build.gradle file
plugins {
    //...
    id "co.elastic.apm.android" version "[latest_version]"
}

//...

elasticApm {
    // Minimal configuration
    serverUrl = "https://your.elastic.apm.endpoint"

    // Optional
    serviceName = "weather-sample-app"
    serviceVersion = "0.0.1"
    secretToken = "your Elastic APM secret token"
}
4. The only code that actually needs to be changed is the one line that initializes the Elastic APM Android agent in the Application.onCreate method. The application class for this sample application is located in app/src/main/java/co/elastic/apm/android/sample/MyApp.kt.
package co.elastic.apm.android.sample

import android.app.Application
import co.elastic.apm.android.sdk.ElasticApmAgent

class MyApp : Application() {

    override fun onCreate() {
        super.onCreate()
        ElasticApmAgent.initialize(this)
    }
}
Keep in mind that for this example we are not changing the default configuration of the agent - if you want to learn more about how to do so, check out the agent's runtime configuration guide.
Before launching our Android weather application, we need to configure and start the local weather backend service, as described in the next section.
Set up a local backend service
One of the key capabilities provided by the proxy is distributed tracing, which allows you to see the full end-to-end story of an HTTP transaction, starting with our mobile application and traversing the instrumented backend services used by the application. Elastic APM will show you the big picture in the form of a distributed trace, which is very handy for troubleshooting issues, especially those related to high latency and backend errors.
As part of the sample application, we'll start a simple local backend service to handle our application's HTTP requests. Backend services are instrumented using the Elastic APM Java agent to collect their own APM data and send it to Elastic APM, enabling it to correlate mobile interactions with the processing of backend requests.
In order to configure the local server, we need to set up our Elastic APM endpoint and secret token (the same one our Android app used in the previous step) in the backend/src/main/resources/elasticapm.properties file:
service_name=weather-backend
application_packages=co.elastic.apm.android.sample
server_url=YOUR_ELASTIC_APM_URL
secret_token=YOUR_ELASTIC_APM_SECRET_TOKEN
start demo
Our sample app will get auto-detection for the currently supported frameworks for the proxy, which means we'll see screen rendering spans as well as OkHttp requests out of the box. For frameworks that are not currently supported, you can apply manual instrumentation to enrich your APM data (see "Manual instrumentation" below).
We are ready to start the demo. (The demo is intended to be executed locally using the Android emulator.) Therefore, we need:
- Start the backend service with this command in a terminal at the root of the example project: ./gradlew bootRun (or gradlew.bat bootRun if you're using Windows). Alternatively, you can start the backend service from Android Studio.
- Start the Weather sample application in the Android Emulator (from Android Studio).
With everything running, we need to navigate around the application to generate some load that we want to observe in Elastic APM. So choose a city, click " Next " and repeat as many times as you want. Make sure to select New York at least once. You'll see that the weather forecast doesn't work for the city of New York. Next, we'll use Elastic APM to find out what went wrong when selecting New York.
First look at APM results
Let's open Kibana and navigate to the Observability solution.
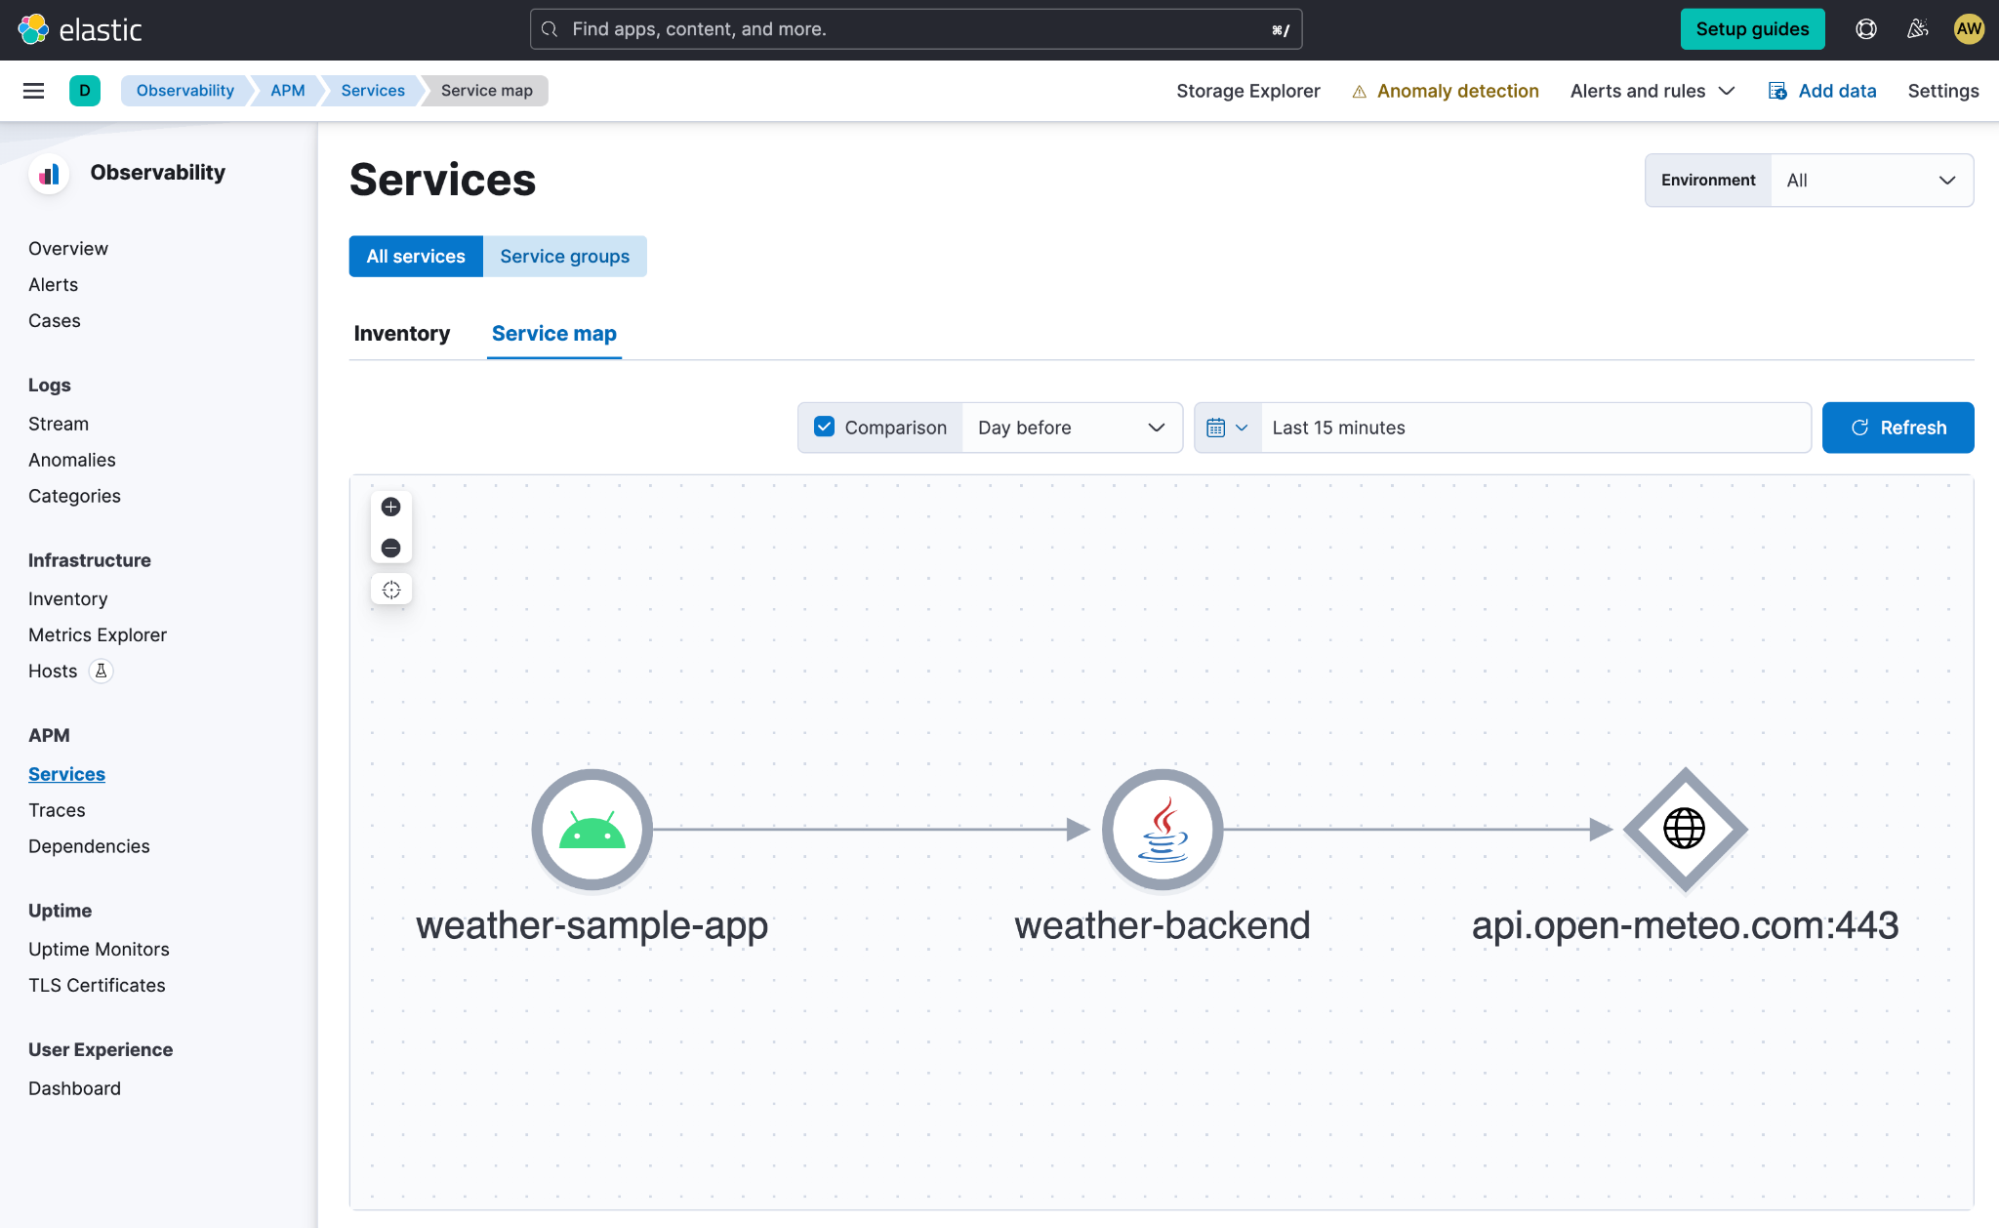
Under the Services navigation item, you should see a list of two services: our Android application weather-sample-app and the corresponding backend service weather-backend . Click on the Service map tab to see a visualization of the dependencies between these services and any external services.
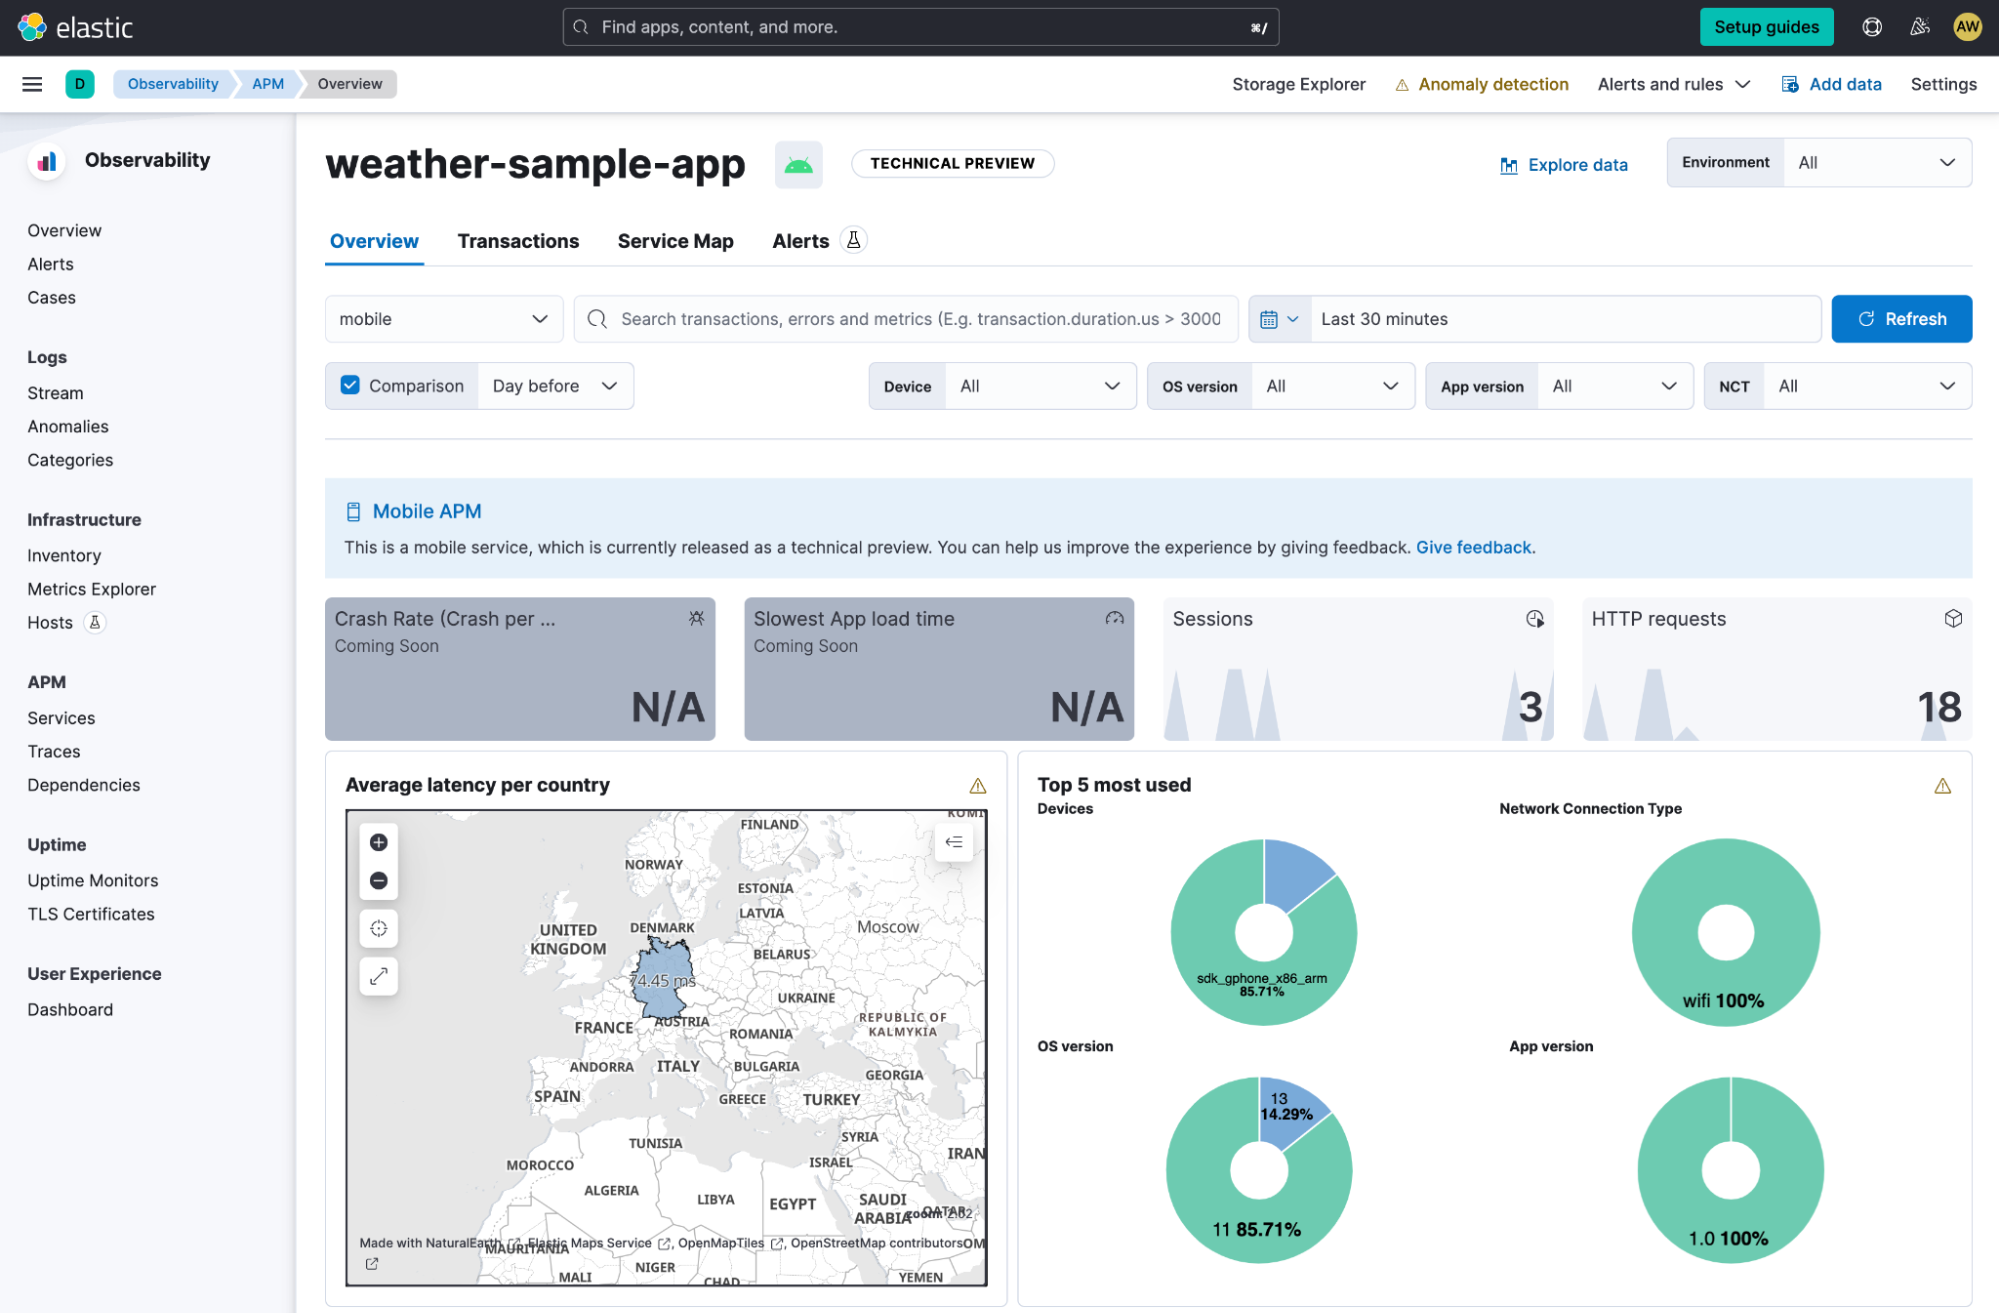
Click weather-sample-app to drill down to the Android app's dashboard. The Services view for the mobile app is in technical preview at the time of publishing this blog post, but you can already see in-depth information about the app on this screen. You'll see the number of active sessions for the selected time frame, the number of HTTP requests made by weather-sample-app, the geographic distribution of requests, and a breakdown of device models, OS versions, network connection types, and app versions. (Information about crashes and app load times is in development.)
For demonstration purposes, we keep this demo simple, so the data is not as diverse and rather limited. However, this type of data is especially useful when you monitor mobile apps that are used more frequently and are more diverse in terms of device models, OS versions, and so on. Troubleshooting and performance issues become easier when you can use these attributes to filter and group your APM data. You can use the quick filters at the top to do this and see how metrics are taken based on your selections.
Now, let's see how individual user interactions are handled, including downstream calls to backend services. Under the Transactions tab (top), we see different groups of end-to-end transactions, including two transactions for FirstFragment and SecondFragment.
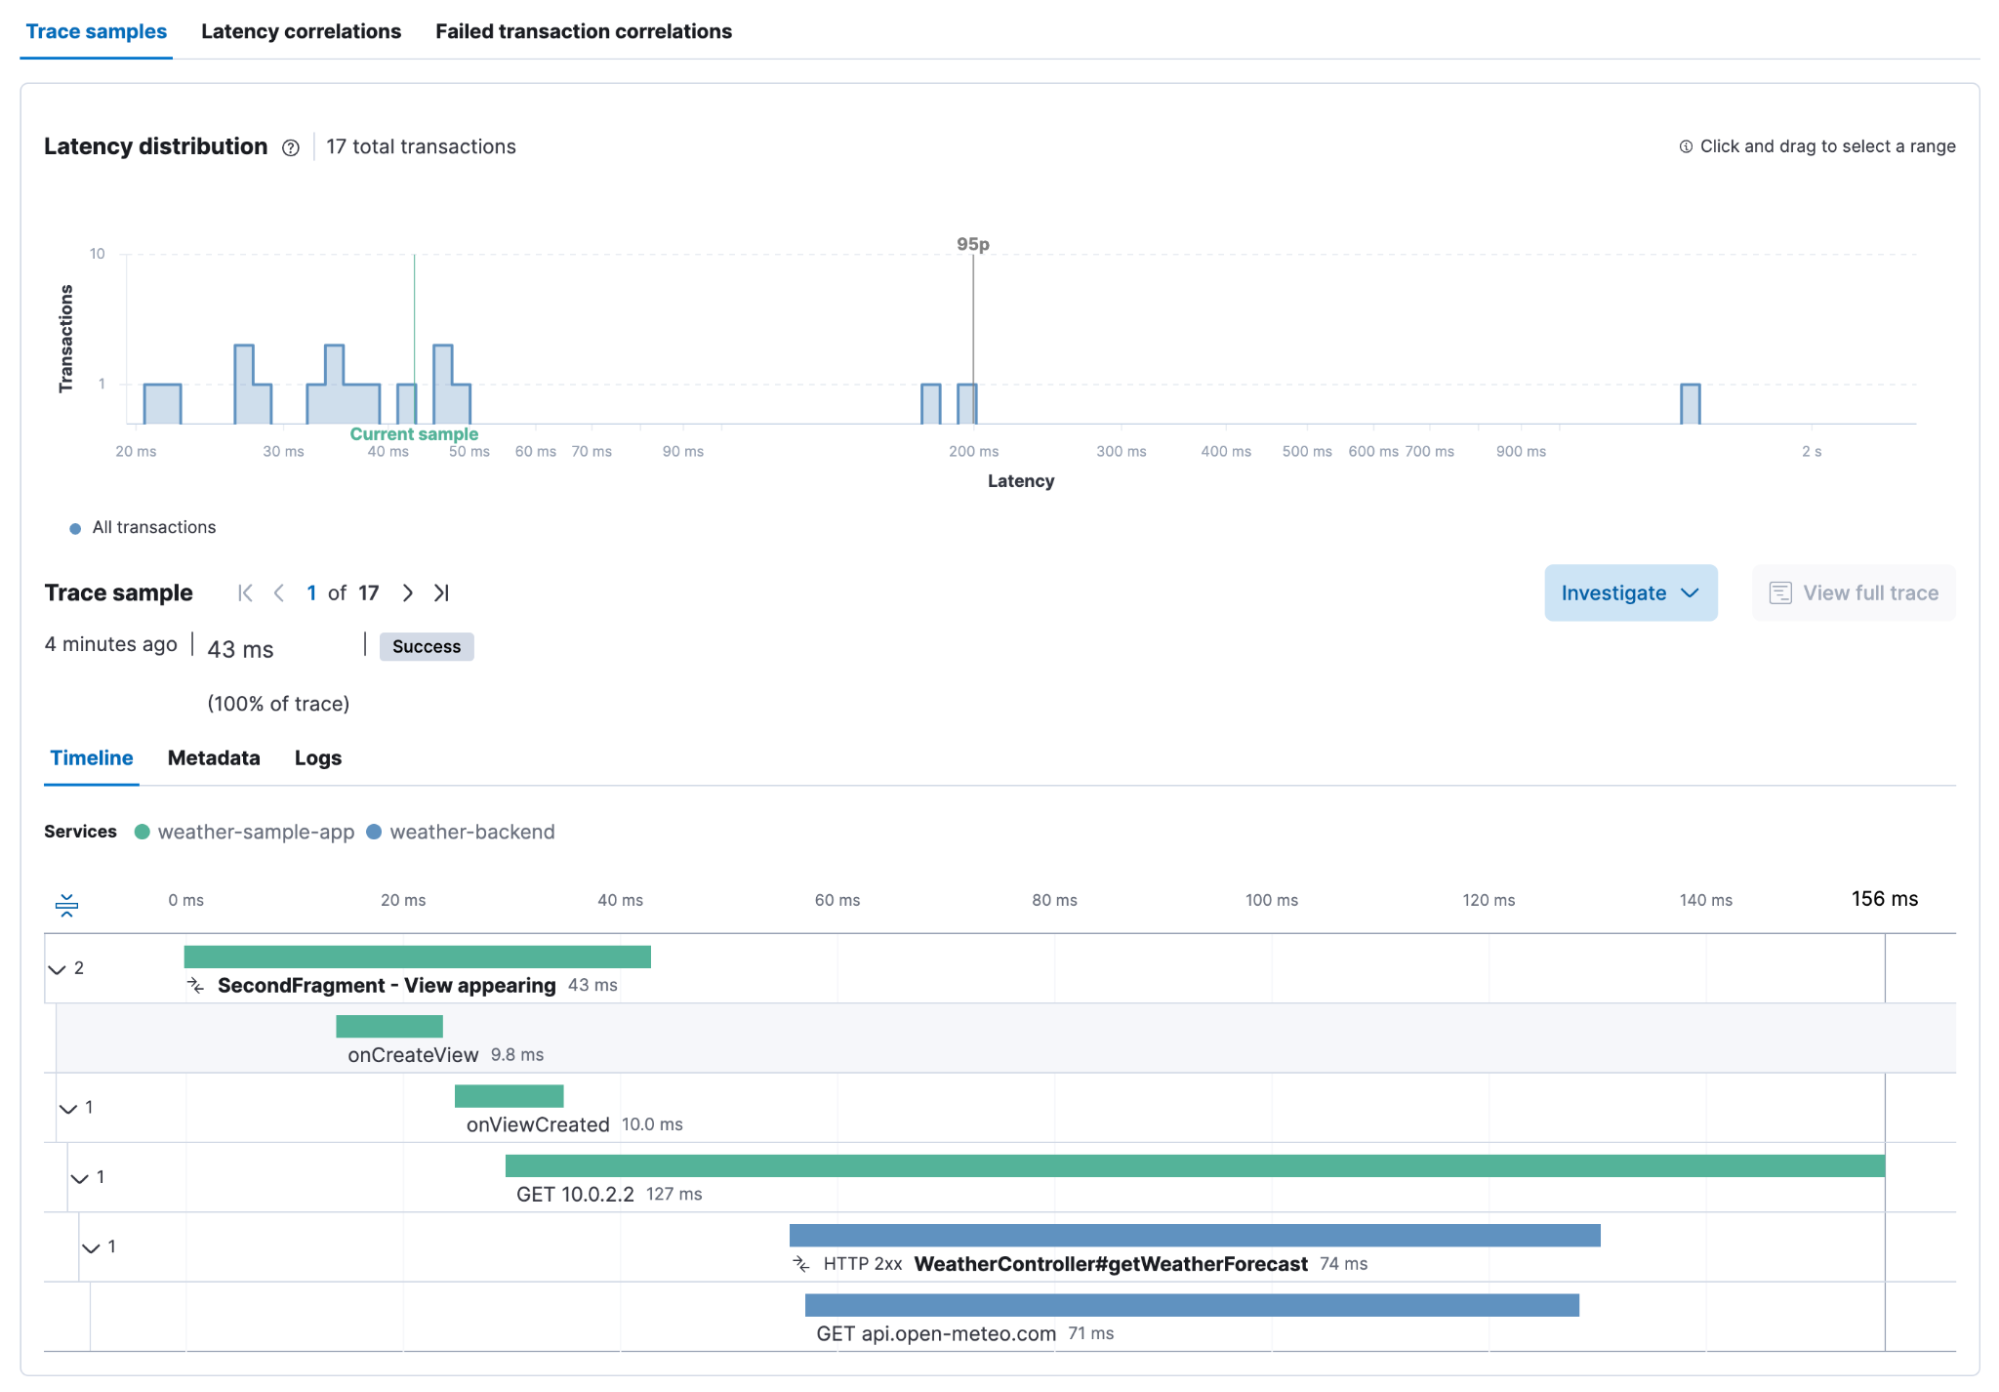
Let's dig into the SecondFragment - look at the transactions that occurred to see metrics for this transaction group (eg latency, throughput) and a waterfall view of calls for individual user interactions. As we can see in the screenshot below, after the view is created, the fragment performs an HTTP GET request to 10.0.2.2 , which takes about 130 milliseconds. In the same waterfall, we see that the HTTP calls are handled by the weather-backend service, which itself makes HTTP calls to api.open-meteo.com.
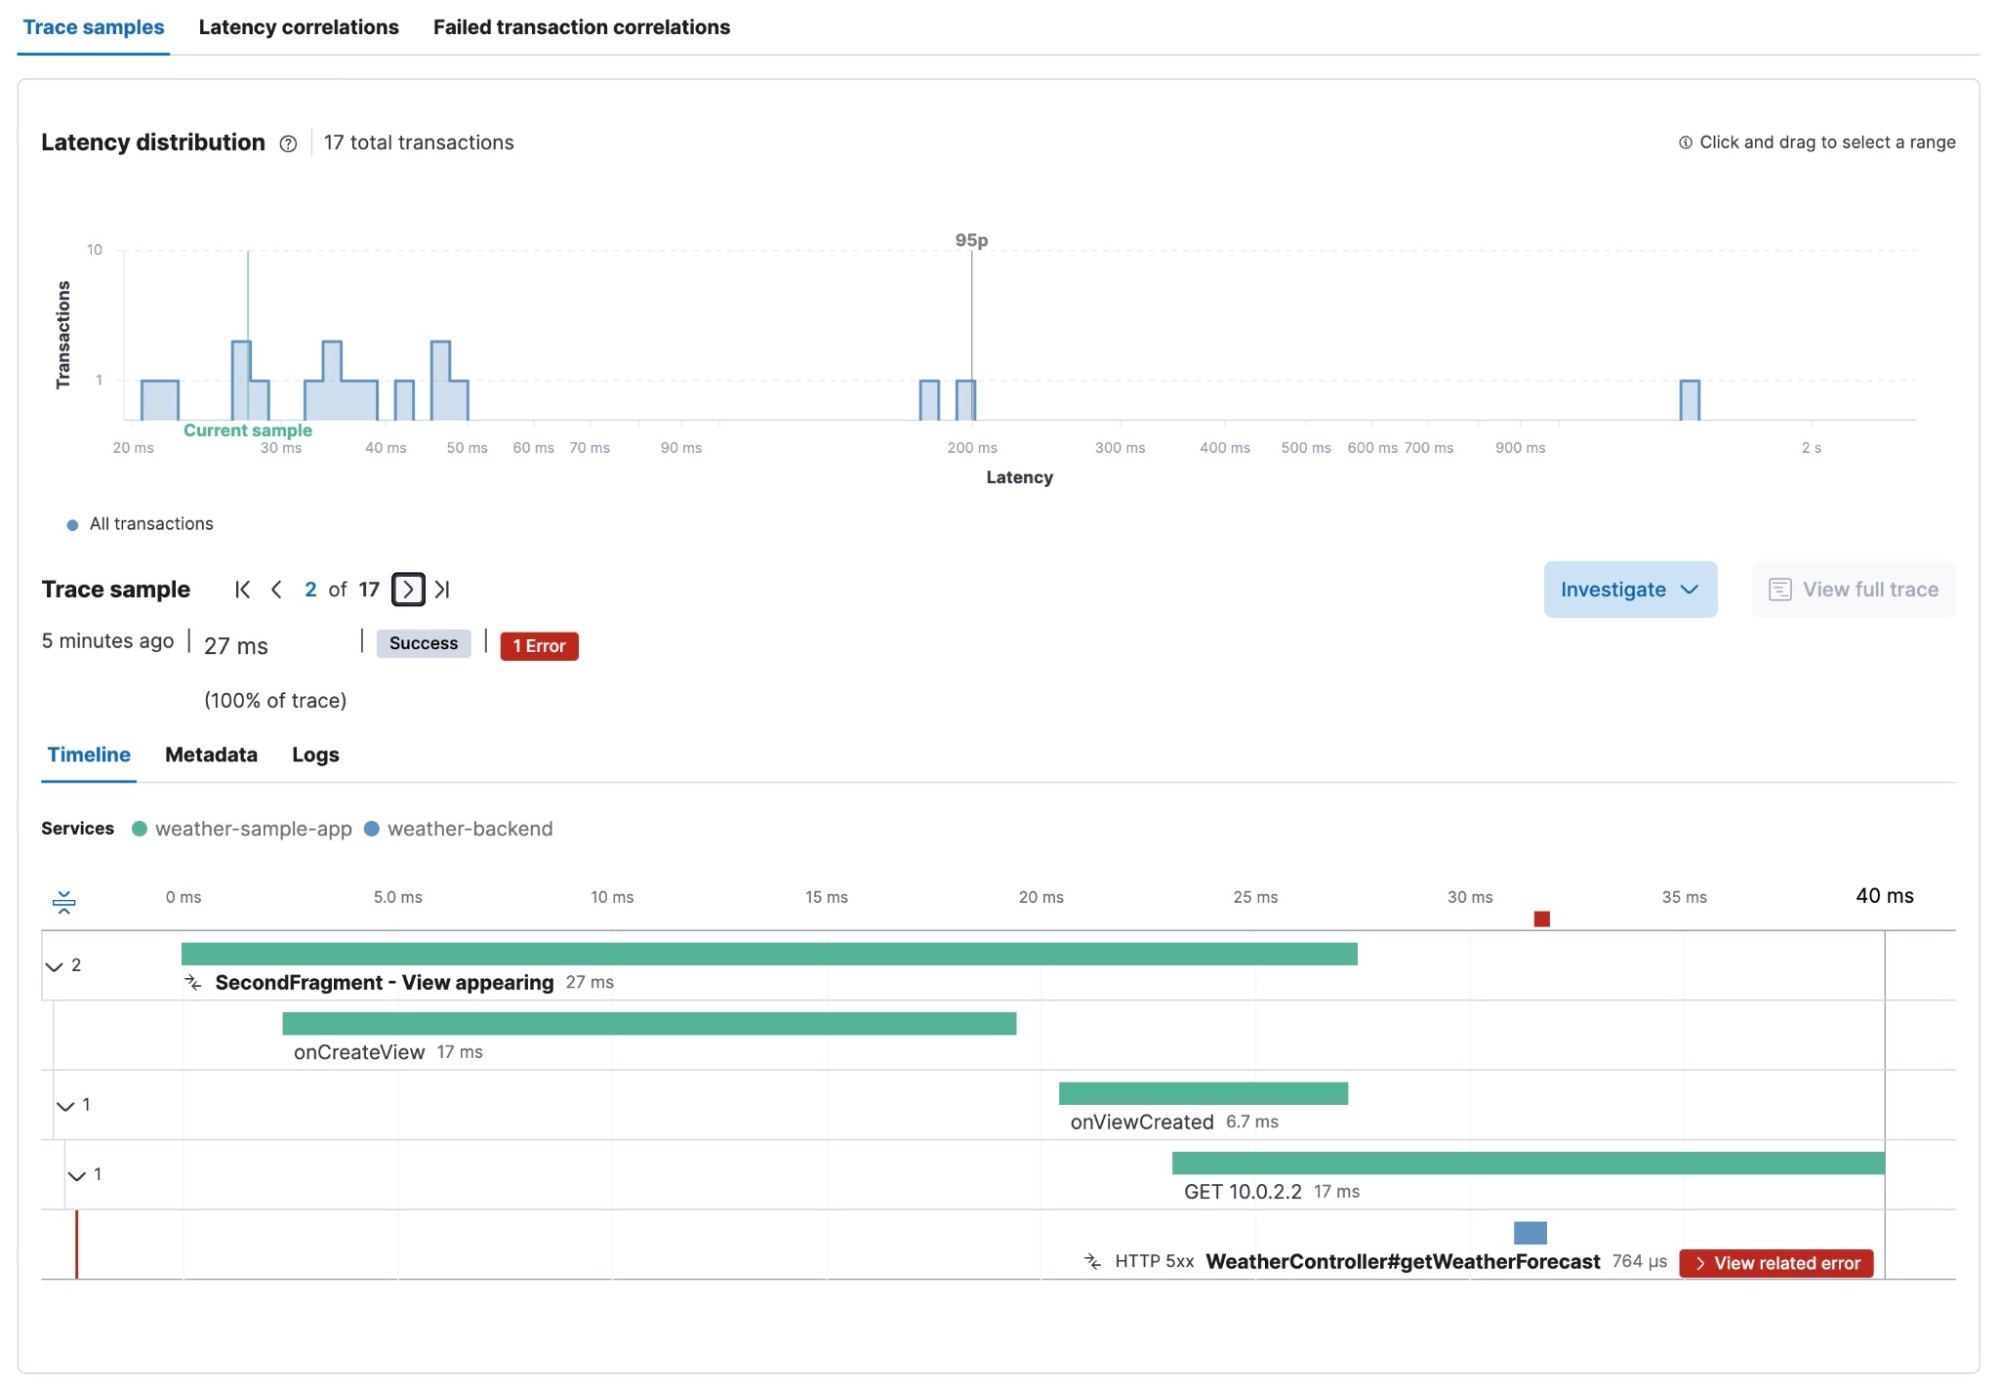
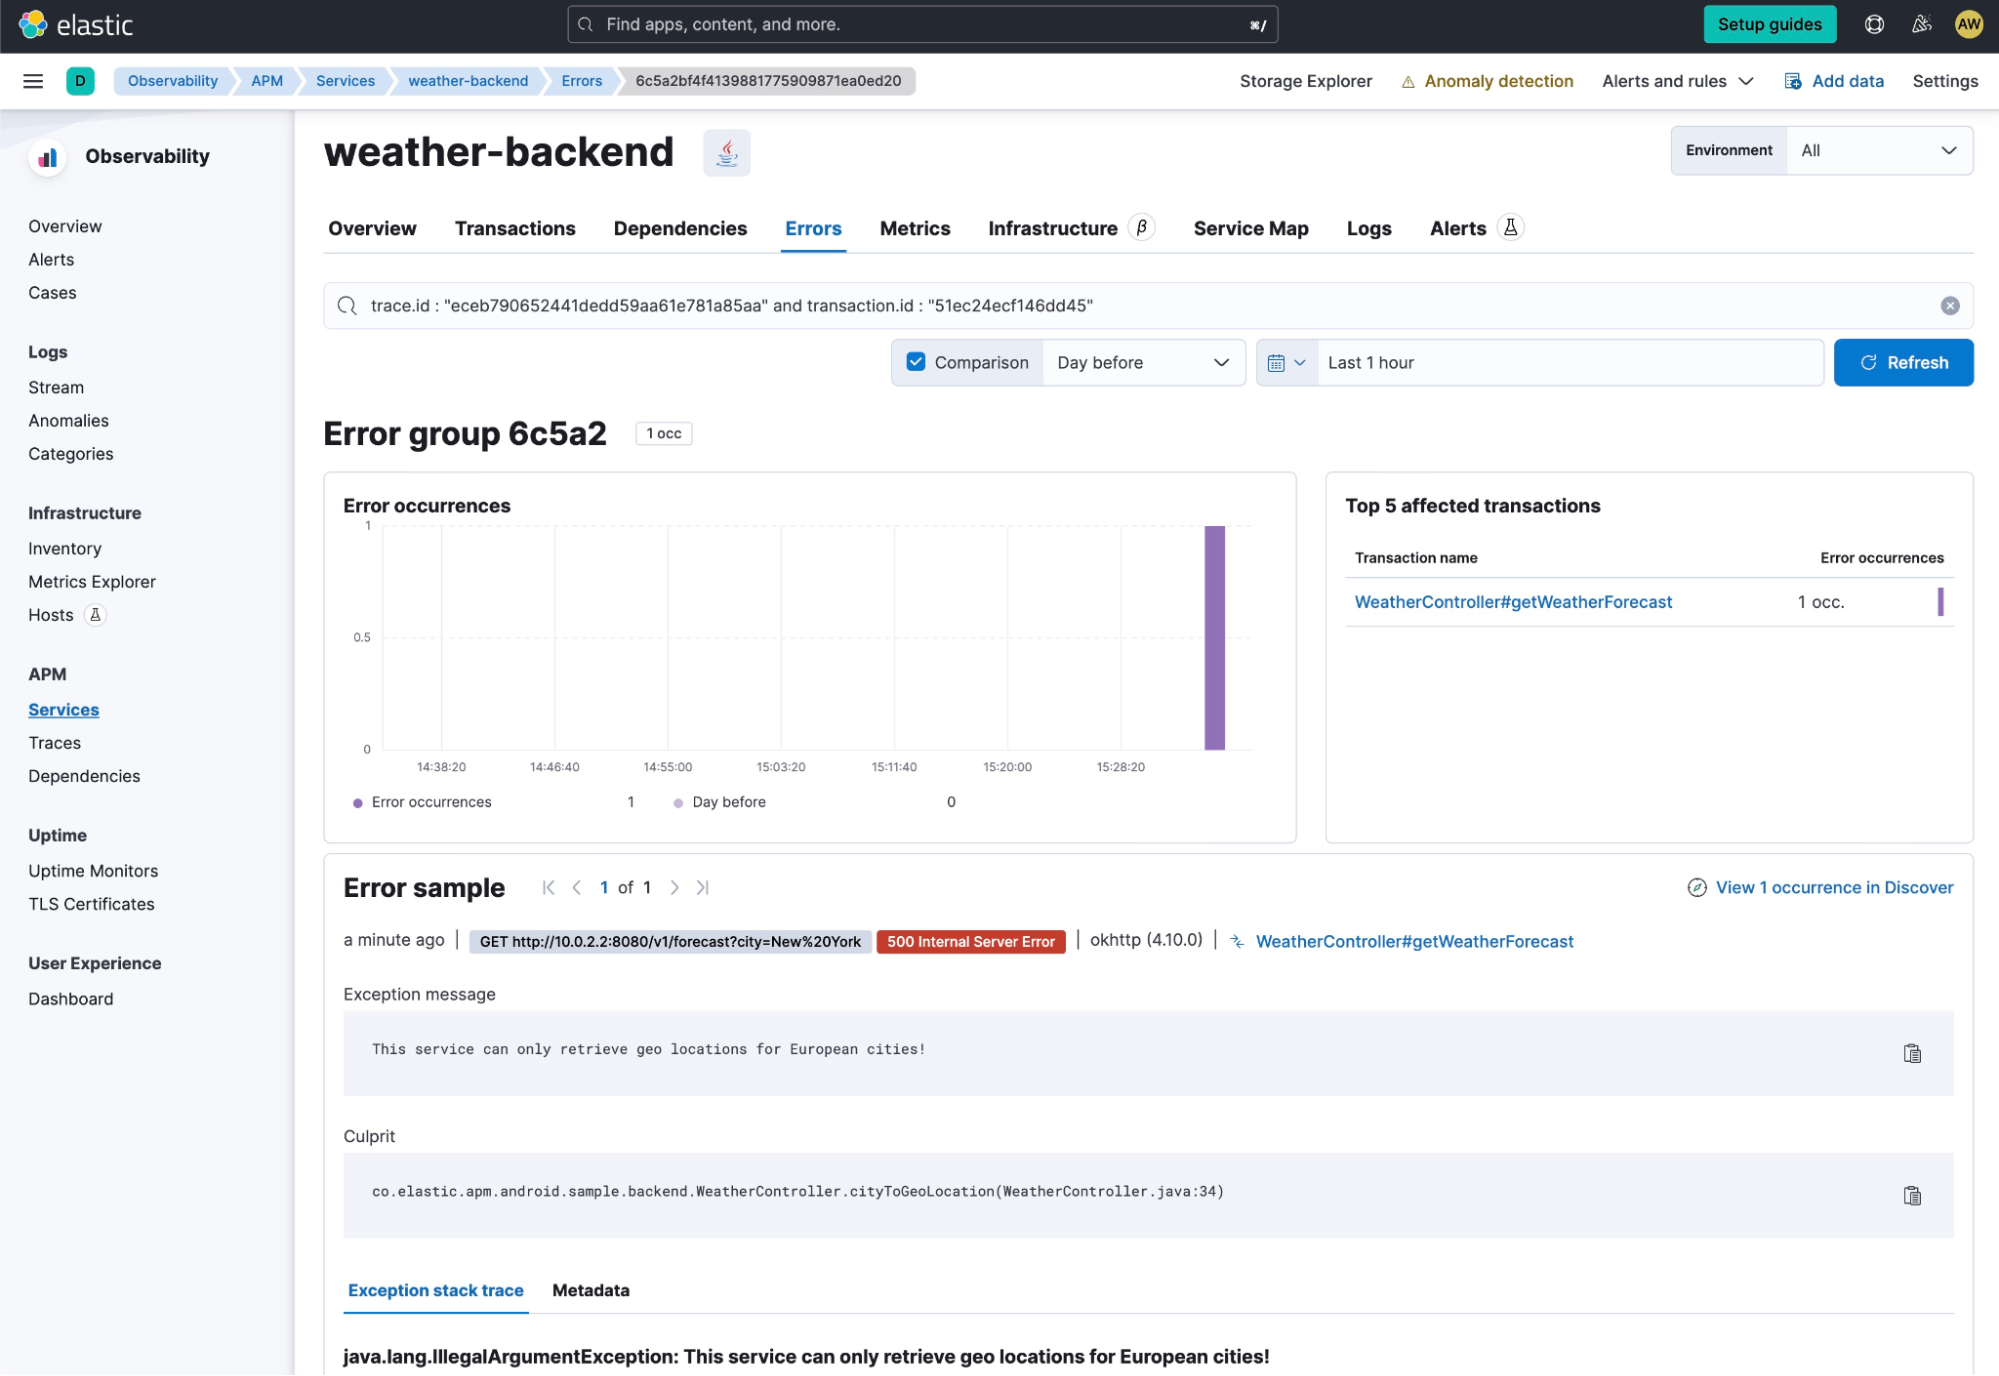
Now, when looking at the waterfall view of the request where New York was selected as the city, we see an error in the backend service, which explains why the forecast doesn't work for New York. By clicking on the red View related error badge, you will get the details of the error and the actual root cause of the issue.
The exception message in the weather backend states "This service can only retrieve geo locations for European cities!" That's the problem with choosing New York as the city.
manual detection
As mentioned earlier, the Elastic APM Android Agent performs a series of automatic detections for supported frameworks on your behalf; however, in some cases, you may want additional detections depending on your application's use case. For these cases, you have learned about the OpenTelemetry API, which is the basis of the Elastic APM Android agent. The OpenTelemetry Java SDK includes tools for creating custom spans, metrics, and logs, and since it is the basis for the Elastic APM Android agent, you don't need to add any extra dependencies to your project or configure anything to use it and Your custom signals are connected to your own Elastic environment, just like the proxy does for you.
The way to get started is to get an instance of OpenTelemetry like this:
OpenTelemetry openTelemetry = GlobalOpenTelemetry.get();You can then create custom signals as described in the OpenTelemetry Java documentation . For an example of creating a custom span, see the following example:
OpenTelemetry openTelemetry = GlobalOpenTelemetry.get();
Tracer tracer = openTelemetry.getTracer("instrumentation-library-name", "1.0.0");
Span span = tracer.spanBuilder("my span").startSpan();

// Make the span the current span
try (Scope ss = span.makeCurrent()) {
  // In this scope, the span is the current/active span
} finally {
    span.end();
}
in conclusion
In this blog post, we demonstrated how to use the Elastic APM Android agent to achieve end-to-end observability in an Android-based mobile application. Setting up the proxy takes only a few minutes, and the insights provided allow you to analyze the performance of your app and its dependencies on backend services. With the Elastic APM Android Agent, you can take advantage of Elastic's rich APM capabilities and possibilities to customize your analytics workflow with custom instrumentation and custom dashboards.
Are you curious? Then try it yourself. Sign up for a free trial on Elastic Cloud , enrich your Android apps with the Elastic APM Android agent described in this blog, and explore data in Elastic's observability solutions.
原文:Monitoring Android applications with Elastic APM | Elastic Blog