Author: Jax
Foreword
In the practical application of operation and maintenance process, we need more logging and monitoring to make us have a full understanding of the operational status of their applications. However, for most developers, usually we are concerned about more is how to achieve a more elegant business, or how to make applications faster response speed, etc. associated with the encoding technology, for application monitoring, may still remain at the level of the log file, and most are out of the man after the accident was discovered, and try to locate the problem log.
This article describes the preparation of Elastic APM is a set of indicators for monitoring applications, such as system response time, abnormal, EF execution of SQL records, etc., and these records can be organized into a traceable link to facilitate inquiries. In addition, Elastic APM can also do a very nice visual display by Kibana, to help us locate and identify problems.
Nonsense say no more, we started combat ~
Elastic APM Introduction
Elastic APM by the following four components consisting, as shown below:
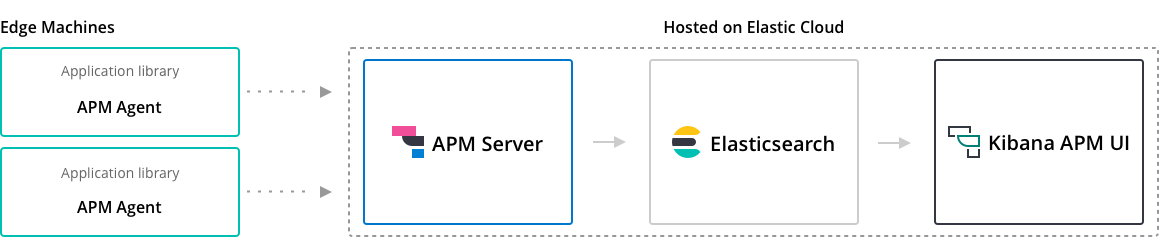
APM Agent
APM Agent is installed into your .NET Core program a Nuget bag, he used to collect performance, errors and other types of data, and data collected cached batches sent to the APM Server. Of course, in addition to the use of .NET Core package Nuget, he also supports many other languages, such as Java, Node.Js, Python, etc.
Refer to the list of supported languages here: https://www.elastic.co/guide/en/apm/agent/index.html
APM Server
APM Server is deployed on the server for a receiving application Agent incoming data packet, and automatically create a document based on the data packet, transfer data to the Elastic Server.
Elastic Search
I believe we are all familiar with, he is a high-performance implementation Lucene-based, distributed full-text search engine for rapid, real-time storage, search and analyze large amounts of data. In speaking here, he provides data storage and search capabilities!
Kibana
If you are familiar with Elastic Search, then you how many will understand Kibana, Kibana is open source analysis and visualization platform, he can carry on with Elastic Search good synergy to help data in Elastic Search in your rapid visual memory, and made a variety of beautiful reports, graphs and so on.
Preparing the Environment
In this combat process, we need the following things:
- Elastic Search
- Kibana
- APM Server
- A .NET Standard 2.0 + based project
Elastic Search Installation: https://www.cnblogs.com/baiyunchen/p/11227144.html
Kibana installation:
My environment is Centos 7, so following https://www.elastic.co/guide/en/kibana/7.3/rpm.html the official website tutorial installation, the whole process is very simple:
- Download Kibana RPM package (in this way is because with yum install speed is too slow, so I use Thunder download the complete rpm files uploaded to the Linux machine)
- Execute the command rpm --install "to download the file name" to install
- After the installation is complete, the /etc/kibana/kibana.yml file, add the following configuration at the end of the file:
server.host: 0.0.0.0
server.name: Host IP
server.port: a port number you like
elasticsearch.hosts: [ "good ES address is installed, use a comma between multiple"]
logging.dest: /var/log/kibana.log // need to advance this file is created, and then enough authority to
- The Kibana installed as a system service and starts
sudo /bin/systemctl daemon-reload
sudo /bin/systemctl enable kibana.service

sudo systemctl start kibana.service
Here we must pay attention Elastic Search editions and Kibana must match, or will be error of. (I ES is installed some time ago, so there will be the problem if you install all of the breath, it should be nothing issue)
If you have a problem, unfortunately, you can view the log files by path configuration logging.dest configured.
APM Server Installation
APM Server installation with the installation Kibana similar process is as follows:
- Download the RPM package, the package to find in this version of the page you need, but also need to talk with ES, consistent Kibana version, or you know ~ https://www.elastic.co/cn/downloads/past-releases#apm-server
- Execute rpm --install "to download the file name" to install
- Modify the configuration file in the folder / etc / amp-server in apm-server.yml, will host configuration file beginning: "localhost: 8200" modified "0.0.0.0:8200", so that he can allow ip: access port number, and add the following configuration in the final surface configuration:
output.elasticsearch:
    the hosts: [ "have good ES address of the installation, a plurality of separated by commas"]
- The apm-server is installed as a system service and starts
sudo /bin/systemctl daemon-reload
sudo /bin/systemctl enable apm-server.service

sudo systemctl start apm-server.service
After performing the above operation is completed, the browser tries to open the server Ip: 8200, eventually if APM Server installation is no problem, the browser will print out the contents similar to the following:
{
  "build_date": "2019-06-20T14:39:23Z",
  "build_sha": "9a099b63c53eac8c55707df96193143ec66337e9",
  "version": "7.2.0"
}
At this point we open Kibana in the browser, and then click Add APM

Then scroll down to the newly opened page, click Check APM Server Status button, if You have correctly setup APM Server would indicate that the installation is complete -

Up to this point, our installation work is completed, the next, we try to .NET Core integrate with Elastic APM, continue with it ~
.NET Core Application Integration
We create a Demo program to test for various functions of APM.
Please refer to address the project's GitHub:
Reference dependencies
We need to refer to the relevant SDK from Nuget to do integration with our applications, in fact, it is a reference to the very beginning we said that part of the APM Agent in Nuget, we quote Elastic.Apm.NetCoreAll this package.
This package is the equivalent rely on automatic dependent following three packages, you can rely on only a part of it as needed.
Here we For simplicity, this package directly printed with Elastic.Apm.NetCoreAll
Adding to .NET Core Agent
Found .NET Core the StartUp file, add the following code Configure method in which:
public void Configure(IApplicationBuilder app, IHostingEnvironment env)
{
    app.UseAllElasticApm(Configuration);
}
Then add the following in application.json in:
{
  "ElasticApm": {
    "the LogLevel": "Error", // the Log level, according to their needs to set "ServerUrls": "http: // localhost: 8200", // set up in front of the installed APM Server URL, the default port number is 8200
    "ServiceName": "MyApp", // application name, followed by starting the actual situation on the line, allowed characters:. az, AZ , 0-9, -, _, and space default is the entry assembly of the file application
  }
}
At this point we will start up the project, just refresh a few times, then returned to Kibana, scroll down in the earlier page, select .NET, and then click Check Agent Status button, if successful, it will display "Data successfully received from one or more agents ", if unfortunately failed to show these words, by Diagnostic Tools VS in the Event tracking and see where is not no configuration


View monitoring data
Add APM at the bottom of the page Kibana to find Load Kibana Objects, to create the index, then click APM dashboard button, you can view the page to enter the APM data.

Click APM Dashboard button to display the page as follows:

The page is divided into functional Services, Traces of two large functional blocks, first take a brief look at these two Tab page in the corresponding function.
Services
XianDotnetCommunity shown in the following list is actually your configuration in the configuration file ServiceName, click on the name to enter, and you can see the following reports, there Transactions, Errors, Metrics three Tab page.


among them
Transactions: shows an overview of the current application in the case of a request, a request response including a long time, the number of calls, and so the request
Exception list program: Errors
Metrics: CPU applications where the machine / memory usage
PS: Actually, I think a great need for a current value of application memory and CPU consumed, but it looks like .NET Core versions of the agent does not implement these features, look forward to future updates of it
Traces
Inside is a list of the names do link tracking view Home includes all transactions and response time

Click on the specific transaction in, you can see this transaction through a list of links and more detailed response to some of the information to help you analyze the bottleneck link, the more we go into detail below.

Explore More
Elastic APM There are many other features, such as link tracking, database calls to perform, let's explore it together ~
Monitoring API call tracking link
If you find out about the micro-service architecture, then you must understand the concept of link tracking. What is the link to track it? For chestnut:
A service there, he will rely on the service B, C, and B services will depend on the service D, E, and C service depend on F, G (omitted numerous dependencies), then one day, A service becomes very slow, and that in the end how to locate which service is slow it? At this time, the final link comes in handy -
Let's look at a simple simulation of this nested call:
In one project Demo1 WebAPI has a ConsumerController, which he has an API A, which calls another program Demo2 WEB API interface in B / C / D / E. Code is as follows:
Project A:
[Route("api/consumer")]
[ApiController]
public class ConsumerController : ControllerBase
{
    private readonly IHttpClientFactory _httpClientFactory;
    public ConsumerController(IHttpClientFactory httpClientFactory)
    {
        //使用HttpClientFactory时需要先在StartUp中调用services.AddHttpClient();
        _httpClientFactory = httpClientFactory;
    }

    private const string baseUri = "http://localhost:54597";


    [HttpGet("a")]
    public async Task<string> A()
    {
        //HttpClient client = new HttpClient();
        var client = _httpClientFactory.CreateClient();
        Thread.Sleep(new Random().Next(1, 1500));
        var b = await client.GetStringAsync($"{baseUri}/api/data-source/b");
        var c = await client.GetStringAsync($"{baseUri}/api/data-source/c");
        var d = await client.GetStringAsync($"{baseUri}/api/data-source/d");
        var e = await client.GetStringAsync($"{baseUri}/api/data-source/e");
        return $"b={b} & c={c} & d={d} & e={e}";
    }
}
Project B:
[Route("api/data-source")]
[ApiController]
public class DataSourceController : ControllerBase
{
    [HttpGet("b")]
    public async Task<string> B()
    {
        Thread.Sleep(new Random().Next(1, 1500));
        return "B";
    }

    [HttpGet("c")]
    public async Task<string> C()
    {
        Thread.Sleep(new Random().Next(1, 1500));
        return "C";
    }

    [HttpGet("d")]
    public async Task<string> D()
    {
        Thread.Sleep(new Random().Next(1, 1500));
        return "D";
    }

    [HttpGet("e")]
    public async Task<string> E()
    {
        Thread.Sleep(new Random().Next(1, 1500));
        return "E";
    }
}
At this time, we request API A (xxx / api / consumer / a) Demo1, and then open the Traces APM in Kibana, find the "GET Consumer / A" This record (looks default name is based on Controller + Action named), then click View details.

In the bottom of the details, we find TimeLine, you can see the graphics shown below:

We can see that we spend time at the request API A, respectively, at the time calling the API 4, it can be seen that the third time API calls take longer, click the blue bar you can see the detailed information requested .
Not a good thing here is the default name shows GET localhost so, in fact, we expect is displayed as api uri call, right? I mention this to give them a pr, we can look at: https://github.com/elastic/apm-agent-dotnet/pull/463
EF monitoring execution record
This does not require too much explanation, that is, when the EF executed DB operation, monitoring, in order to detect performance issues, my code is as follows:
[HttpGet ( "Person")]
public void TestEfCore ()
{
    the using (var new new ApmDbContext DB = ())
    {
        var new new JAX = the Person
        {
            the Name = "Xi .NET community",
            Age = 26 is,
            Remark, the = "do the best the technical community ~ "
        };

        db.Persons.Add (JAX);

        db.SaveChanges ();

        db.Persons.FirstOrDefault (X => == x.Id jax.Id);

        db.Persons.FirstOrDefault (X => x.Name == "Xi .NET community");

        jax.Name = ".NET community Xi";
        db.SaveChanges ();

        db.Persons.Remove (JAX);
        db.SaveChanges ();
    }
}
When we use Kibana view this request, TimeLine is shown below:

We can visually see clearer in this request, do what SQL statements, each consuming much of our request analysis, that was quite useful. Click on a specific blue bar, you can see more detailed data, but more unfortunately, the data does not record SQL Params, for which we would like to fully reproduce this request, that was not friendly enough -

Buried own record
Relatively speaking, Elastic APM ecosystem is currently not good enough, or slightly less than the sky walking some support component, if you want to use Elastic APM, do some of their own inevitably Buried record performance data, or as a third-party components, class libraries do support, but also need to do some buried point data. Then we at our request, we want to bury some of the additional information recorded in the sample code as follows:
[HttpGet]
public void RecordMyApmData()
{

    var transaction = Agent.Tracer.CurrentTransaction;

    var span1 = transaction.StartSpan("Stage 1", "Customize");
    Thread.Sleep(300);
    span1.End();

    Thread.Sleep(200);


    var span2 = transaction.StartSpan("Stage 2", "Customize");
    Thread.Sleep(100);
    span2.End();

    Thread.Sleep(100);

    var span3 = transaction.StartSpan("Stage 3", "Customize");
    Thread.Sleep(500);
    span3.End();
}
Finally recorded results are as follows:

The Demo although writing is very simple, but I'm sure you probably have been able to make up the brain Elastic Apm Agent how to use this class to customize some of the monitoring data they need to capture the ~
Exception Monitoring
When our program exception occurs, Elastic APM can help you record this function and log similar, but may be a little less easy to use than a little log. We have a look at it ~
Sample code is as follows:
[HttpGet]
public void TestException ()
{
    the try
    {
        the throw new new Exception ( "exception capture");
    }
    the catch (Exception)
    {

    }

    the throw new new Exception ( "uncaught exception");
}
After executing the code, we can then look at the Errors Tab page by clicking exception to the Service Name

Click on the details, we can see the detailed call stack information:

In addition, we can Trasactions Tab, locate the requested exception occurred, and then click to see the details in the details, we can see this exception occurred:

to sum up
This article describes how to use Elastic APM collected in .NET Core application performance and abnormal data, and use Kibana visual analysis, on the whole, Elastic APM was quite strong, for performance monitoring, link tracking, exception monitoring is basically enough used.
For now, Elastic APM support components is still relatively limited, such as database queries also only support for EF Core, does not support more components, link tracking to track HTTP request is only supported, but also useless support in other ways. In addition, I think Elastic APM to monitor alarm (Watcher) to charge into the X-Pack package is also very sad, abnormal monitoring alarm but it is still quite critical.
Welcome to try Elastic APM, problem areas to explore -