Introduction to APMs
APM is generally considered to be the abbreviation of Application Performance Management. It mainly has three aspects, namely
- Logs (log),
- Traces (link tracking)
- Metrics (report statistics).
When you come into contact with any APM system in the future, you can analyze what kind of system it is from these three aspects. Metrics can be used for service alarms, and Tracing and Logging are used for debugging and finding problems. Monitoring, tracing and logging are the cornerstones of observability
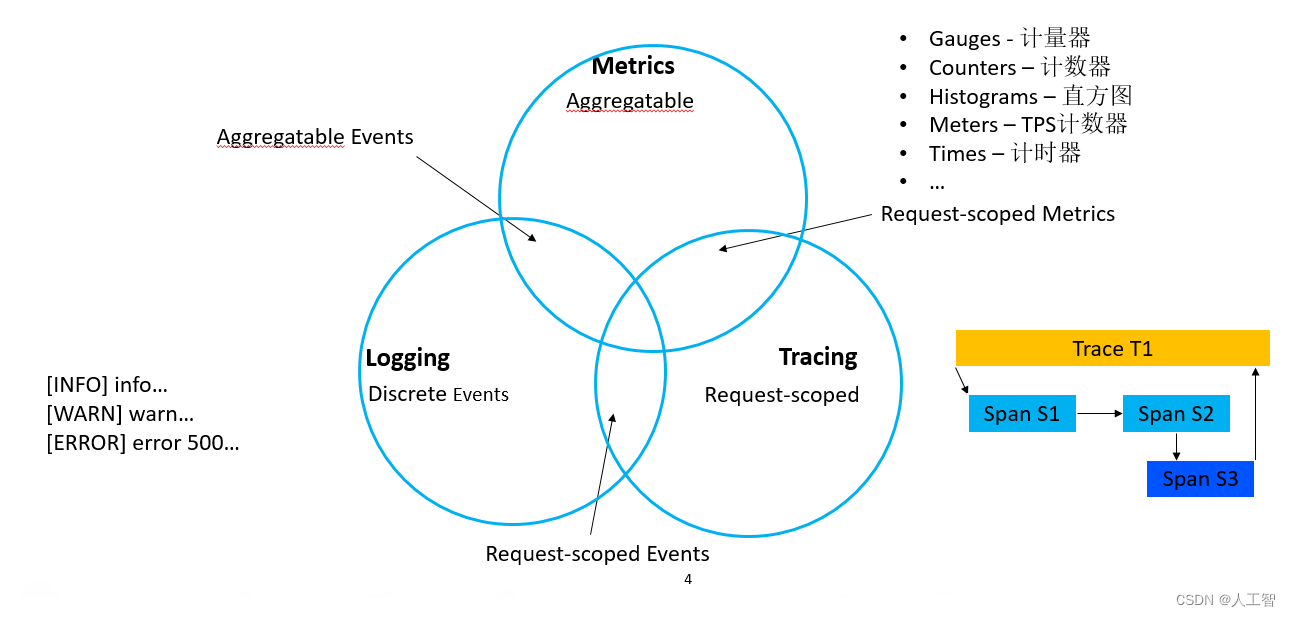
In some scenarios, APM specifically refers to the Metrics in the above three, and we will not discuss this concept here. In this section, we first introduce these three aspects, and introduce some commonly used tools in these three fields.
1、Metrics
Prometheus: Collect metrics
Alarm Manager: Send alerts to various providers based on metric queries
Grafana: Turn the data collected by prometheus into a visual luxury dashboard
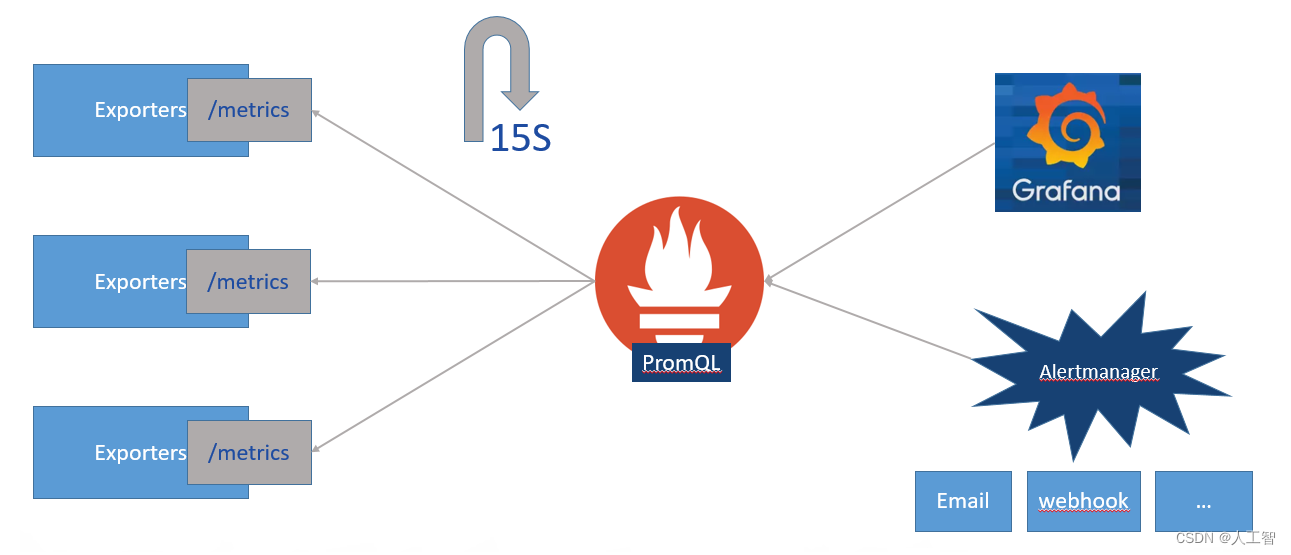
. Comprehensive real-time monitoring and alarm service.
Advantages: powerful monitoring functions, basically can cover various monitoring scenarios
Disadvantages: higher access costs, greater intrusion into business codes
1. Logs is to collect the logs printed in an application and provide query capabilities.
- The typical implementation of Logs is ELK (ElasticSearch, Logstash, Kibana) . The three projects are all open sourced by Elastic. The core of which is that the storage and query performance of ES has been recognized by everyone and has withstood the business test of many companies. Logstash is responsible for collecting logs, then parsing and storing them in ES. There are usually two mainstream log collection methods. One is to use a client program FileBeat to collect the logs printed to the local disk by each application and send them to Logstash; the other is that each application does not need to store the logs in the Disk, but sent directly to the Kafka cluster for consumption by Logstash.
Kibana is a very useful tool for visualizing ES data. Simply put, it is the client of ES.
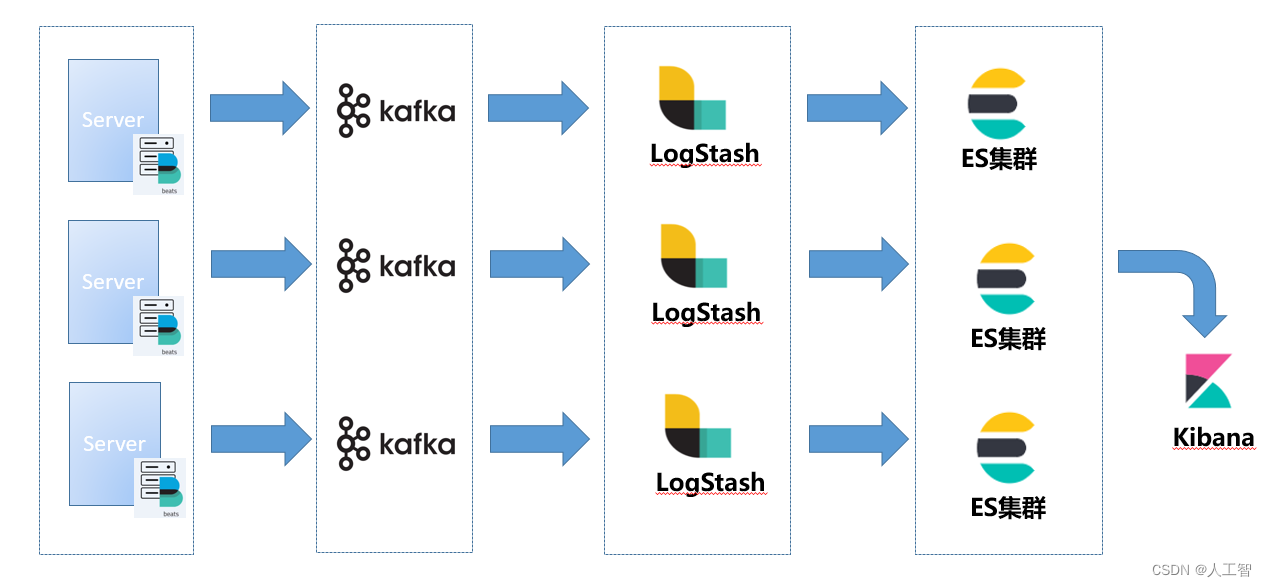
Let's go back and analyze the Logs system. The data of the Logs system comes from the logs printed in the application. Its characteristic is that the amount of data may be large, depending on how the application developer prints the logs. The Logs system needs to store a full amount of data, and usually supports Store for at least 1 week.
Each log contains information such as ip, thread, class, timestamp, traceId, message, etc. The technical points involved are very easy to understand, that is, the storage and query of logs.
It is also very simple to use. When troubleshooting, you usually search for a log by keyword first, and then search for the log of the entire link by its traceId.
As an aside, in addition to Logs, Elastic also provides solutions for Metrics and Traces, but currently domestic users mainly use its Logs function.
2. Traces system, which is used to record the entire calling link.
The Logs system introduced earlier uses the logs printed by developers, so it is the closest to the business. The Traces system is farther away from the business. It focuses on which applications and methods have been passed after a request comes in, how much time is spent on each node, and where the exception is thrown. It is used to quickly locate question.
After years of development, although the Traces system has various designs on the server side, the design on the client side gradually tends to be unified. Therefore, with the OpenTracing project, we can simply understand it as a specification, which defines a set of APIs. The client's model is solidified.
With the popularization of microservice architecture, a large number of distributed tracing systems have emerged, but the APIs are incompatible with each other, and it is difficult to integrate and switch. Therefore, OpenTracing proposes a unified platform-independent and vendor-independent API, which can be implemented by different distributed tracing systems. This effect is similar to "JDBC".
OpenTracing is a lightweight normalization layer that sits between "Application/Library" and "Logging/Tracing".
Application/library layer example: developers want to add tracking data when developing application code, ORM class library wants to add the relationship between ORM and SQL, HTTP load balancer uses OpenTracing standard to set requests, cross-process tasks (gRPC, etc. ) inject trace data using OpenTracing's standard format. All of these only need to be connected to the OpenTracing API, and there is no need to care about how to collect and implement subsequent tracking, monitoring, and logs.
In the current mainstream Traces system**, Jaeger and SkyWalking** use this specification, but Zipkin and Pinpoint do not use this specification.
SkyWalking should be used by more companies in China. It is an excellent open source project initiated by Chinese people and has entered the Apache Foundation.
Another good open-source Traces system is Pinpoint, which is open-sourced by Koreans, and it has a lot of RBI data. It is better to use skywalking in China. There is a mature community, and you can join the group to communicate with the founder.
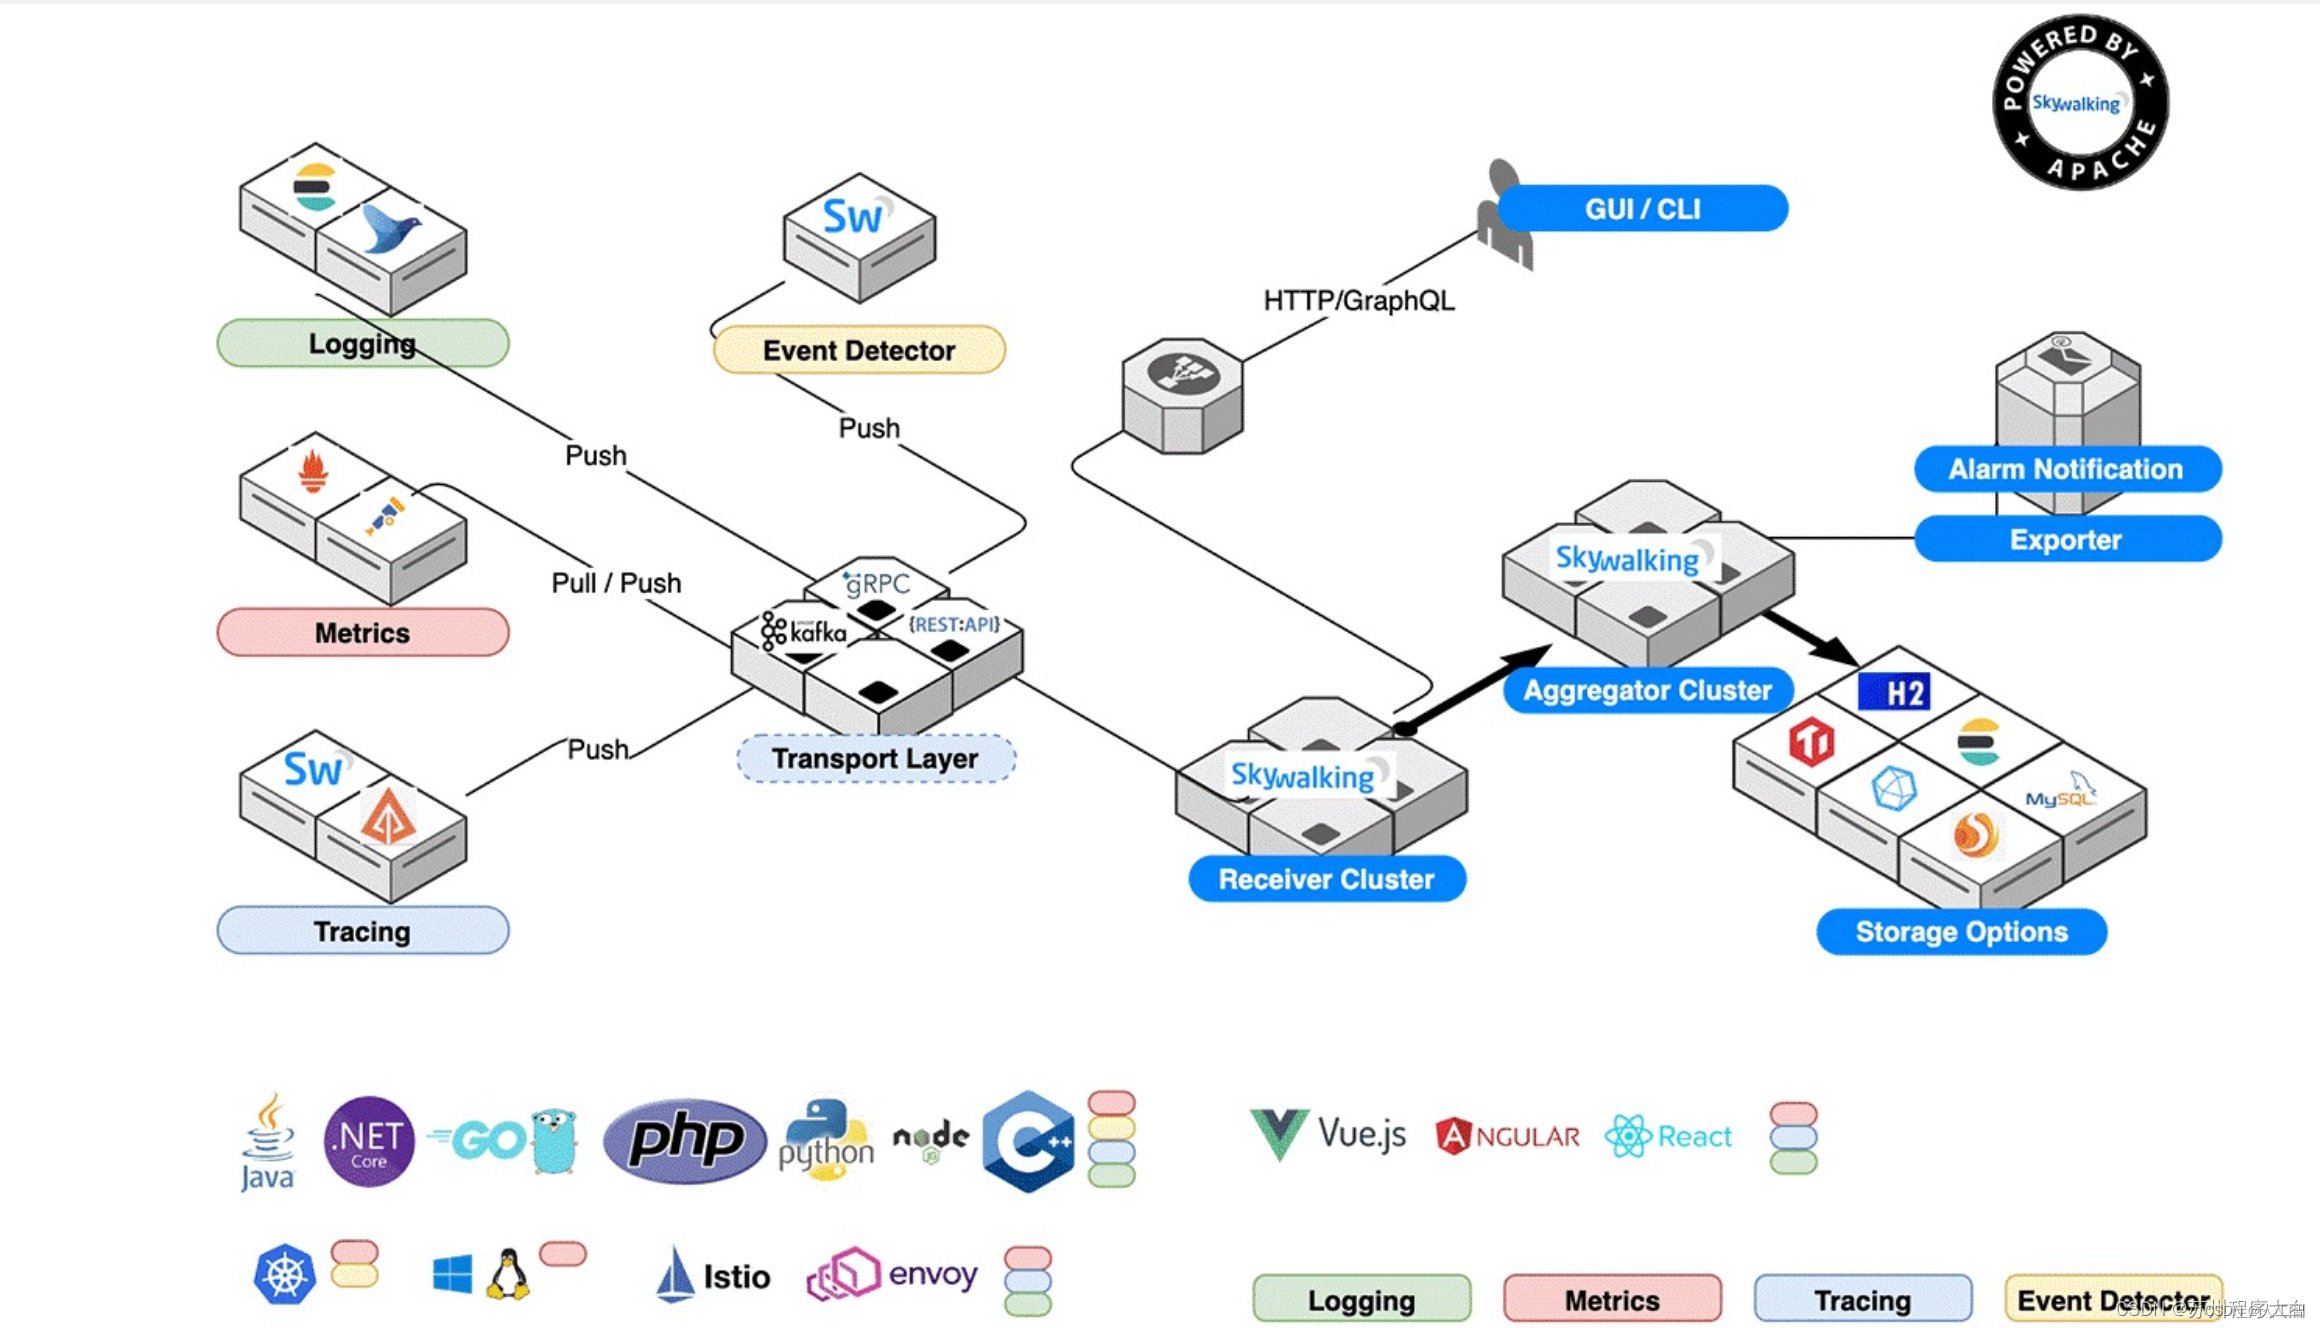 Skywalking currently wants to make a tracking, monitoring, and logging all-in-one solution (Tracing, Metrics and Logging all-in-one solution).
Data collection: Tracing depends on the probe (Agent), Metrics depends on Prometheus or the new version of Open Telemetry, and logs are passed through ES or Fluentd.
Data transmission: Transfer to Skywalking Reveiver via kafka, Grpc, HTTP
Data parsing and analysis: OAP system for data parsing and analysis.
Data storage: the backend interface supports multiple storage implementations, such as ES.
UI module: Query through GraphQL, and then display through the front-end built by VUE.
Alarms: Various alarms can be connected, and the latest version already supports DingTalk.
参考:
1、https://developer.aliyun.com/article/971591?spm=a2c6h.14164896.0.0.5b90c520Bz1nGI
2、https://developer.aliyun.com/article/1053064
3、https://blog.51cto.com/mingongge/3313415