By David Hope
In a recent blog post, we showed you how to get started with Elastic's free, open layer of observability . Below, we walk through what you need to do to scale your deployment so you can start collecting metrics from application performance monitoring (APM) or tracking data in your cluster for free.
Add free and open Elastic APM as part of Elastic Observability deployment - 8.x
What are APMs?
Application performance monitoring lets you understand where your applications are spending their time, what they are doing, what other applications or services they are calling, and what errors or exceptions they are encountering.
In addition, APM also allows you to view the history and trends of key performance indicators, such as latency and throughput, as well as transaction and dependency information:
Whether you're setting up SLA violation alerts, trying to measure the impact of the latest release, or deciding where to make the next improvement, APM can help you with root cause analysis, which can help improve user experience and improve your average resolution time ( MTTR) approaches zero.
For a more introduction to Elastic APM, read the article " Observability: Application Performance Monitoring/Management (APM) in Practice ".
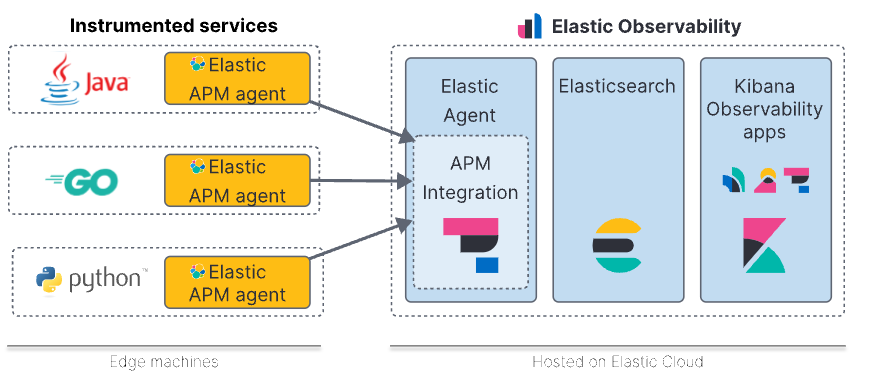
logical architecture
Elastic APM relies on the APM integration inside the Elastic Agent, which forwards application trace and metrics data from applications instrumented with the APM agent to the Elastic Observability cluster. Elastic APM supports several proxy styles:
- Native Elastic APM agent supporting multiple languages including Java, .NET, Go, Ruby, Python, Node.js, PHP, and client-side JavaScript
- Code instrumented with OpenTelemetry
- Code instrumented with OpenTracing
- Code instrumented with Jaeger
In this blog, we'll provide a quick example of how to instrument your code with the native Elastic APM Python agent, but the overall steps are similar for other languages.
Note that there is a big difference between Elastic APM Agent and Elastic Agent. As you can see in the image above, these are very different components, so it's important not to confuse them.
Install Elastic Agent
The first step is to install the Elastic Agent. You need to install Fleet first , or you can install Elastic Agent independently. Follow this guide to install Elastic Agent somewhere. This will give you an APM integration endpoint you can access. Note that this step is not required in Elastic Cloud, as we host the APM integration for you. Check that the Elastic Agent is started by running:
curl <ELASTIC_AGENT_HOSTNAME>:8200Instrumenting the sample code with the Elastic APM agent
The instructions for the various language agents vary by programming language, but at a high level they have a similar flow. First, you add a dependency on the agent in the language's native specification, and then configure the agent so it knows how to find the APM integration.
You can try any style you like, but I'll use this Python example I created to walk through the Python commands.
Get the sample code (or use your own)
First, I clone the GitHub repository, then change into the directory:
git clone https://github.com/davidgeorgehope/PythonElasticAPMExample
cd PythonElasticAPMExample
How to add dependencies
Adding Elastic APM dependencies is easy - check the app.py file in the github repository and you'll notice the following line of code.
import elasticapm
from elasticapm import Client

app = Flask(__name__)
app.config["ELASTIC_APM"] = {
    "SERVICE_NAME": os.environ.get("APM_SERVICE_NAME", "flask-app"),
    "SECRET_TOKEN": os.environ.get("APM_SECRET_TOKEN", ""),
    "SERVER_URL": os.environ.get("APM_SERVER_URL", "http://localhost:8200"),
}

elasticapm.instrumentation.control.instrument()
client = Client(app.config["ELASTIC_APM"])
Flask's Python library is able to detect transactions automatically, but you can also start transactions in code, like we did in this example:
@app.route("/")
def hello():
    client.begin_transaction('demo-transaction')
    client.end_transaction('demo-transaction', 'success')
configure proxy
The agent needs to send application trace data to the APM integration, for which it must be accessible. I configured the Elastic Agent to listen on the localhost's IP, so anything on the subnet can send data to it. As you can see from the code below, we use docker-compose.yml to pass in configuration through environment variables. Please edit these variables for your own Elastic installation.
# docker-compose.yml
version: "3.9"
services:
  flask_app:
    build: .
    ports:
      - "5001:5001"
    environment:
      - PORT=5001
      - APM_SERVICE_NAME=flask-app
      - APM_SECRET_TOKEN=your_secret_token
      - APM_SERVER_URL=http://host.docker.internal:8200
Some explanations for the above:
- service_name : If you omit this, it will default to the name of the application, but you can override it here.
- secret_token : Secret tokens allow you to authorize requests to the APM server, but they require the APM server to be set up with SSL/TLS and have the secret token set up. We are not using HTTPS between the agent and the APM server, so we will comment out this line.
- server_url : This is how the agent can access the APM integration inside the Elastic Agent. Replace it with the name or IP of the host running the Elastic Agent.
Now that the configuration on the Elastic APM side is complete, we just need to follow the steps in the README to start it.
docker-compose up --build -dThe build step will take a few minutes.
You can navigate to the running sample application by visiting http://localhost:5001 . There isn't much sample content, but it does generate some APM data. To generate a little load, you can reload them a few times or run a quick little script:
#!/bin/bash
# load_test.sh
url="http://localhost:5001"
for i in {1..1000}
do
  curl -s -o /dev/null $url
  sleep 1
done
This just reloads the page every second.
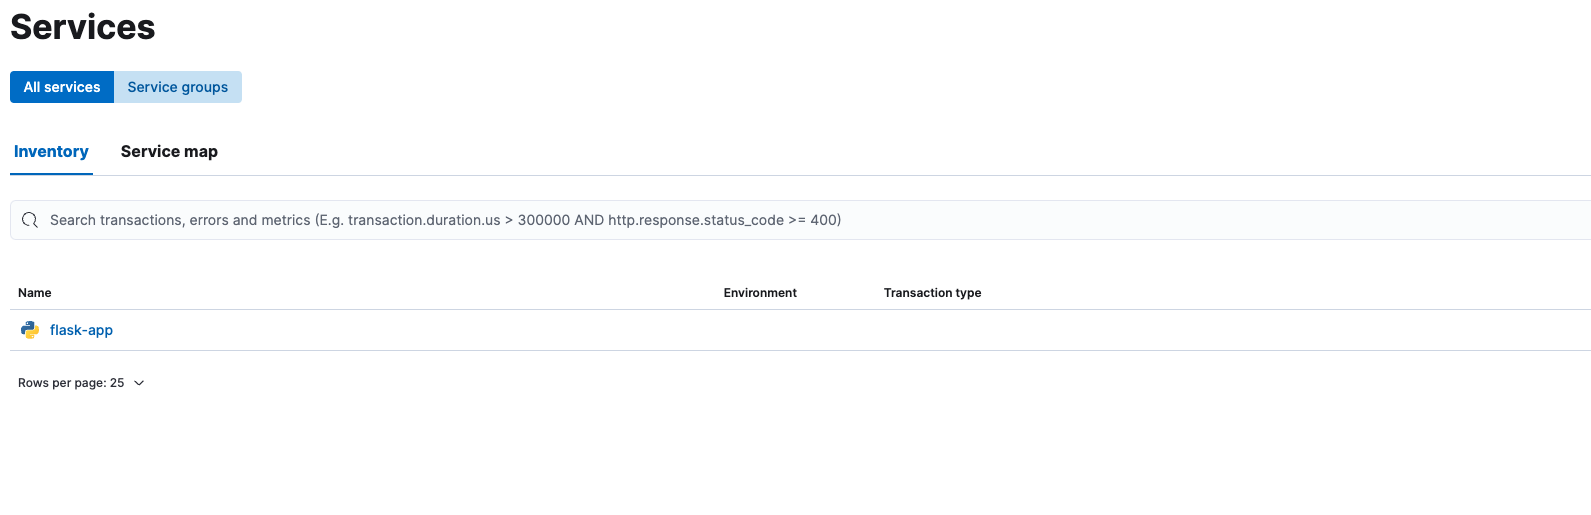
Back in Kibana, navigate back to the APM application (the hamburger icon, then select APM ), and you should see our new flask-app service (I left my local deployment running so it shows more history):
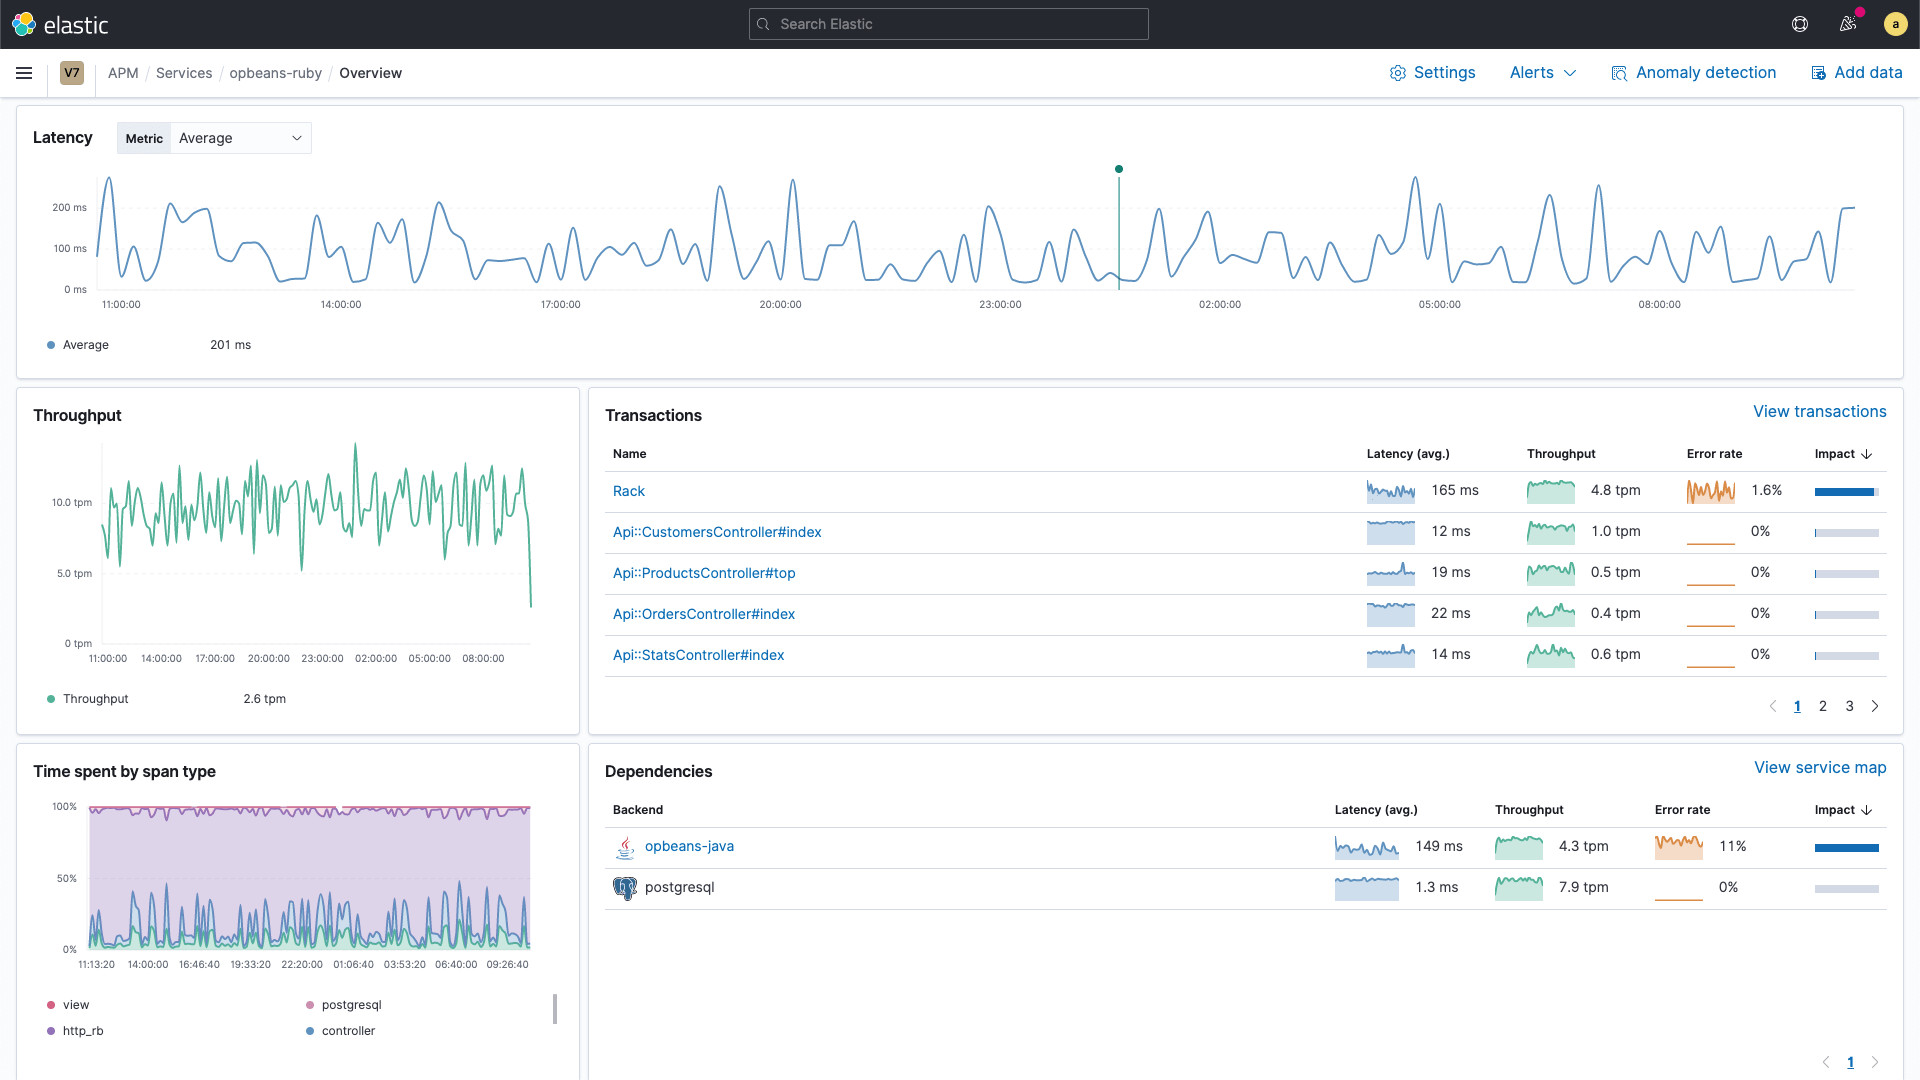
 The service overview page provides an overview of service health in one place. If you are a developer or SRE, this page will help you answer the following questions:
- How does a new deployment affect performance?
- What is the most affected transaction?
- How does performance relate to the underlying infrastructure?
This view provides a list of all applications that have sent application trace data to Elastic APM within the specified time period (in this case, the past 15 minutes). There are also sparklines showing latency, throughput, and error rates. Clicking on flask-app takes us to the service overview page, which shows the various transactions in the service (recall that my script is accessing the / endpoint, as seen in the Transactions section). We got bigger graphs of latency, throughput, errors and error rates.
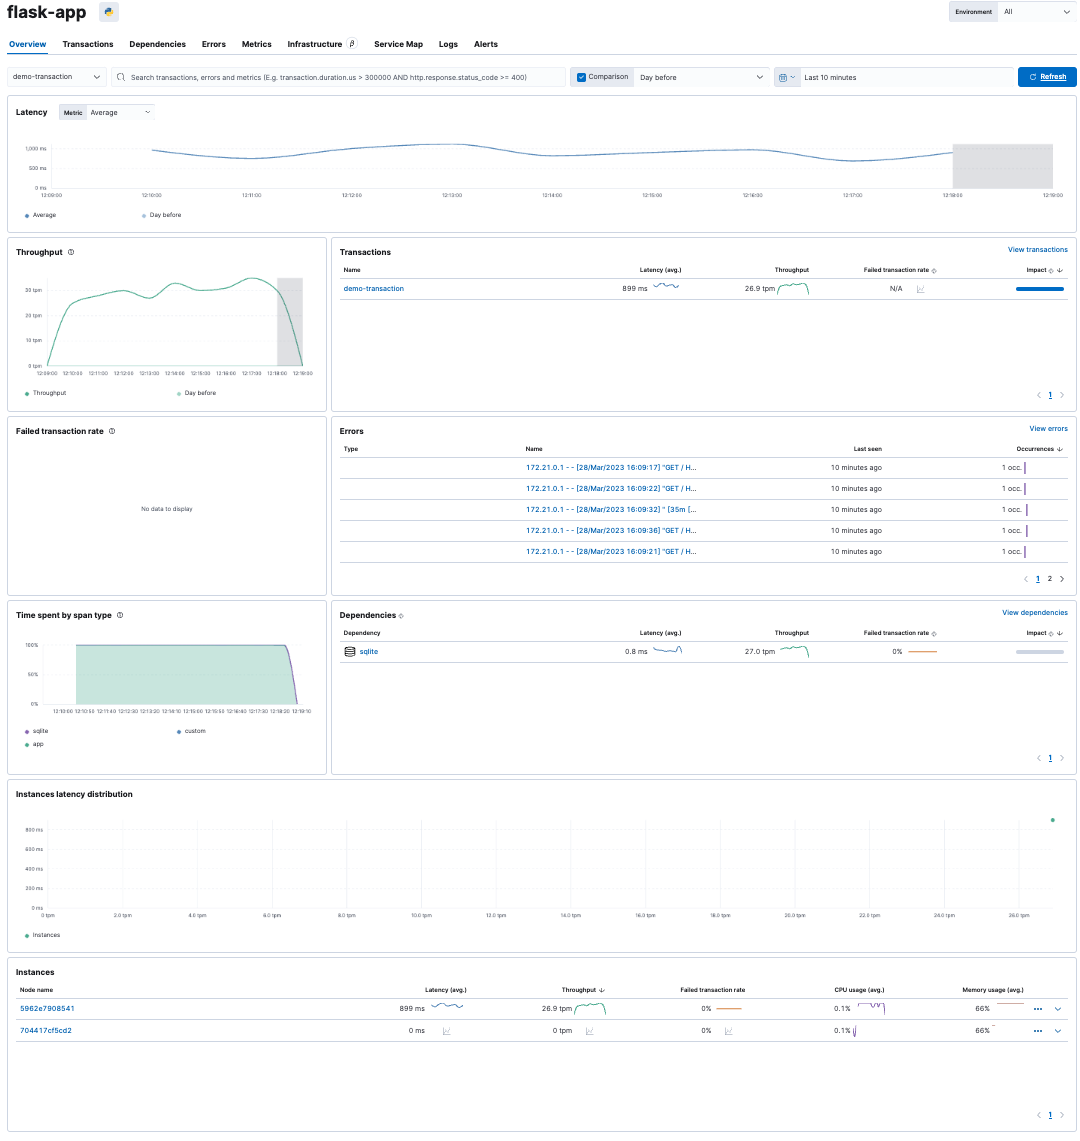
When you instrument real applications under real load, you'll see far more connections (and errors!)
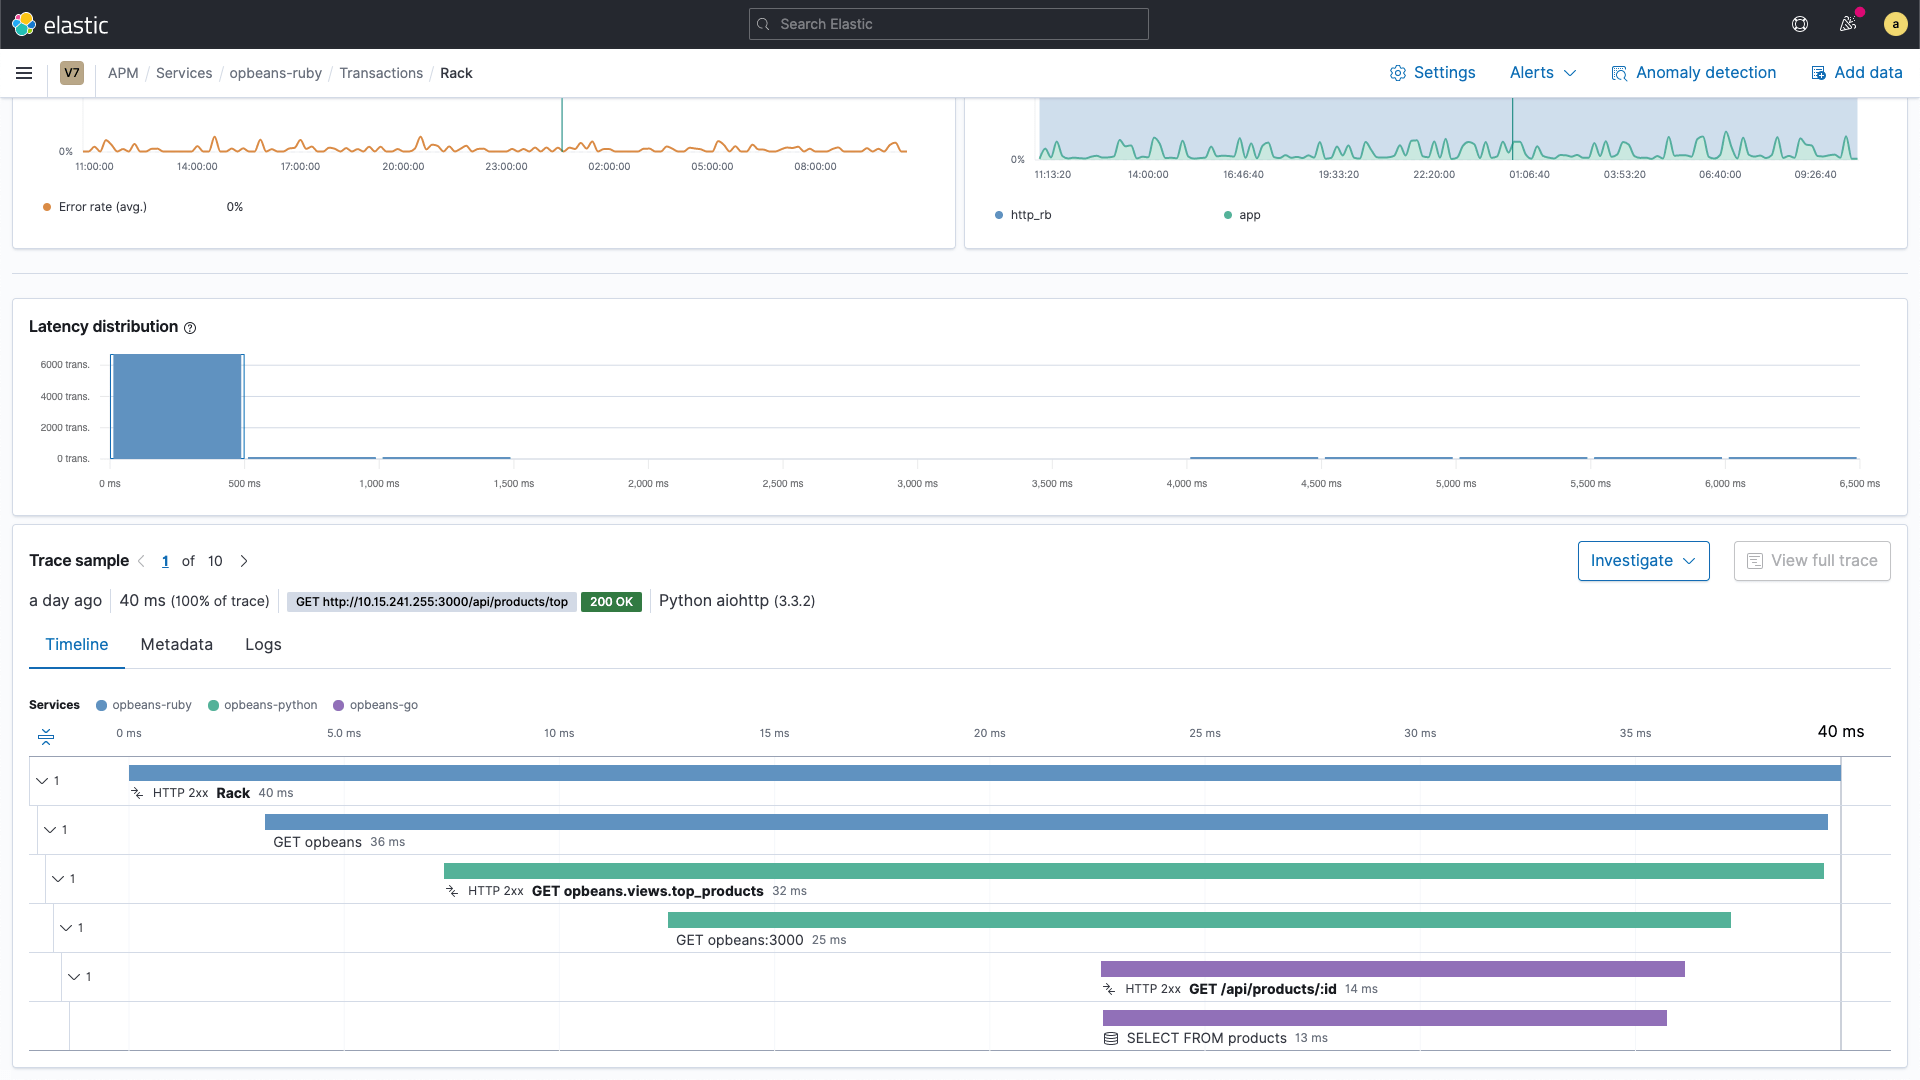
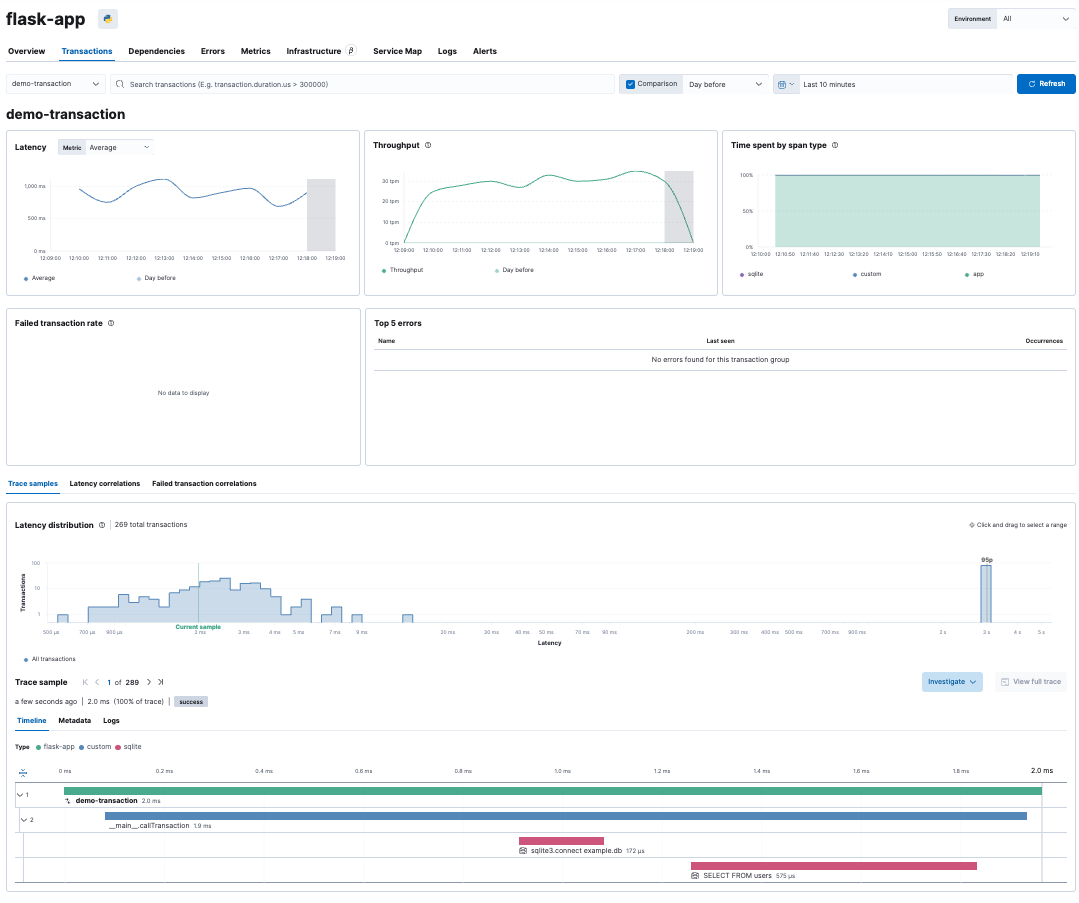
Clicking on a transaction in the transaction view, in this case the demo-transaction transaction of our sample application , we can see exactly which operations were called:

This includes details about calling external services, such as database queries:
What's next?
Now that you've got your Elastic observability cluster up and running and collected out-of-the-box application trace data, explore the public API for the language your application uses, which allows you to take your APM data to the next level. These APIs allow you to add custom metadata, define business transactions, create custom spans, and more. You can find the public API specifications for various APM agents (such as Java , Ruby , Python, etc.) on the APM agents documentation page .
If you'd like to learn more about Elastic APM, watch our webinar on Elastic APM's transition to cloud-native to learn about other ways Elastic APM can help you in your ecosystem.
If you decide you'd rather have us host your observability cluster, you can sign up for a free trial of Elasticsearch Service on Elastic Cloud and change your proxy to point to your new cluster.