
Compensated contributions can be made to the econometrics economy circle, and measurement related can be
Email: [email protected]
All the do files, micro-databases and various software of the econometric circle methodology are placed in the community. Welcome to the micrometric research group for exchanges and visits. Thank you Zhao ri group friends for their strong support to the econometric circle.

Today, our "Micro-Econometric Research Group" will recommend an article "Least absolute deviations estiamtion for the censored regression model" for the circle friends in the econometric circle. This article is mainly dedicated to solving the "merging problem" of dependent variables, especially when an important condition of our commonly used Tobit model is no longer satisfied-the residuals of the regression do not gradually obey the normal distribution, and do not Satisfy the nature of the same variance. Earlier we wrote an article "The two-column model Hurdle far surpasses Tobit, and who should I do for the merged data", which explains in more detail the "double-column model", "Tobit model" and "two-part model" when merged data appears. "The use of.
Now this article is mainly applicable to the situation when the residual term in our regression does not satisfy the asymptotic normal distribution or has heteroscedasticity. The estimation method we use is not the commonly used "maximum likelihood estimation" (assuming to obey a distribution and then construct the likelihood function for maximization), but the "least absolute deviations" picture used for quantile regression. In a paper published by Powell in JOE in 1984, he demonstrated that the estimator β of "merging minimum absolute deviation" is asymptotically consistent, and it also gradually obeys the normal distribution (according to the limit distribution theory), and his variance-covariance matrix is also Can be estimated in a large sample.
These β estimators obtained above can provide a basis for us to perform "hypothesis testing", such as the t-test and F-test that we often use need this information. Powell's article also said that we can use the hausman test to obtain information about "whether our regression residuals are homoscedastic or heteroscedastic" or "model setting error" information-one uses clad for regression, one uses tobit Wait for the maximum likelihood estimation to do the regression, and use the hausman test to see whether the estimated values obtained by the two regressions are statistically significant.
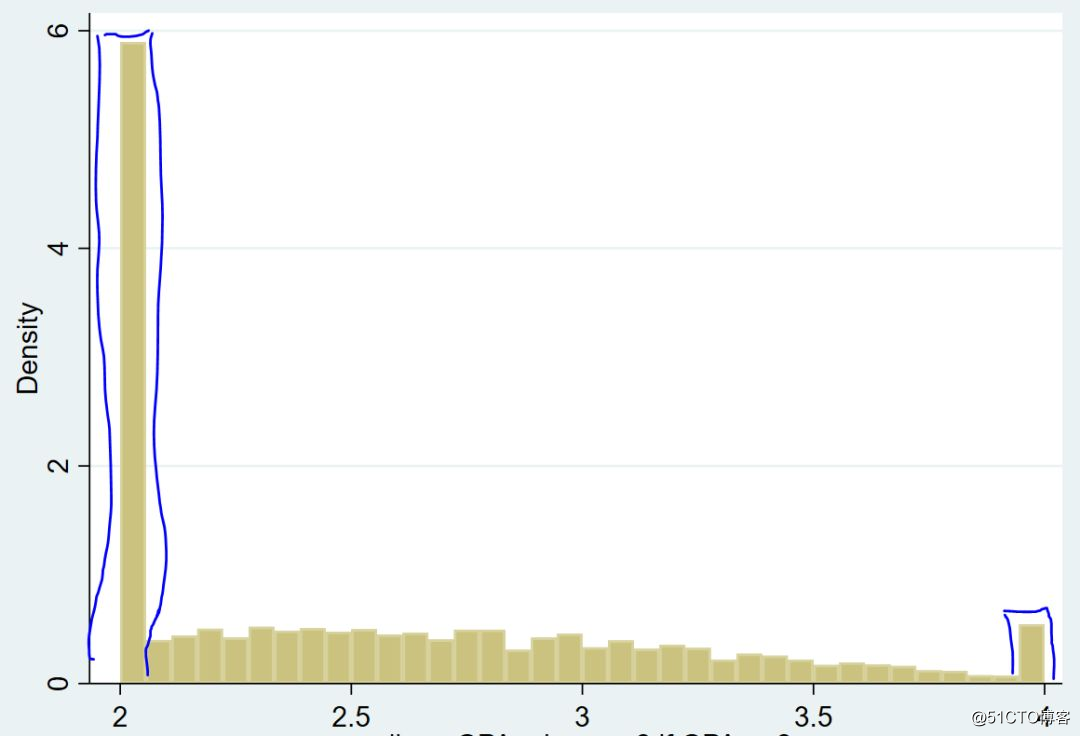
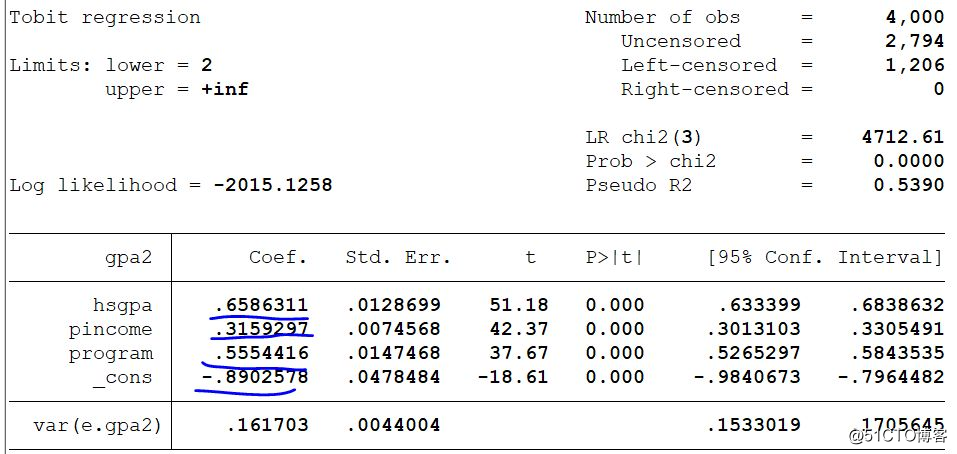
Now, let's use a piece of data to see how clad actually operates, and what is the difference between the result obtained and Tobit? The dependent variable y in the following data has obvious left-end merging phenomenon, and the right side also has merging phenomenon. The left end of y is merging to 2. We plan to use the Tobit model to do a left merge regression first.
This left-merge Tobit regression yields more significant coefficients, and the overall significance of the equation is also quite good.

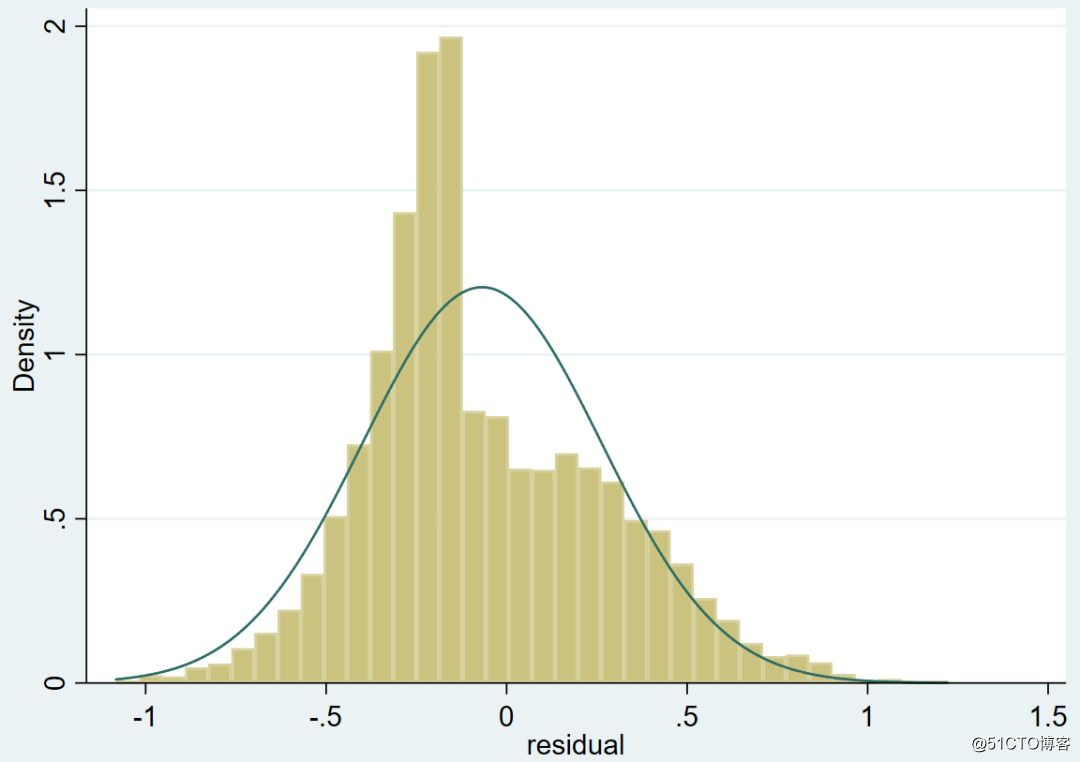
After the regression, we obtained the residual of Tobit regression through prediction (note: the option option should be selected carefully when predicting). By drawing the histogram and the density line of the normal distribution, we found that the residual is slightly right-skewed, but we cannot judge whether it is a normal distribution only by graphs.
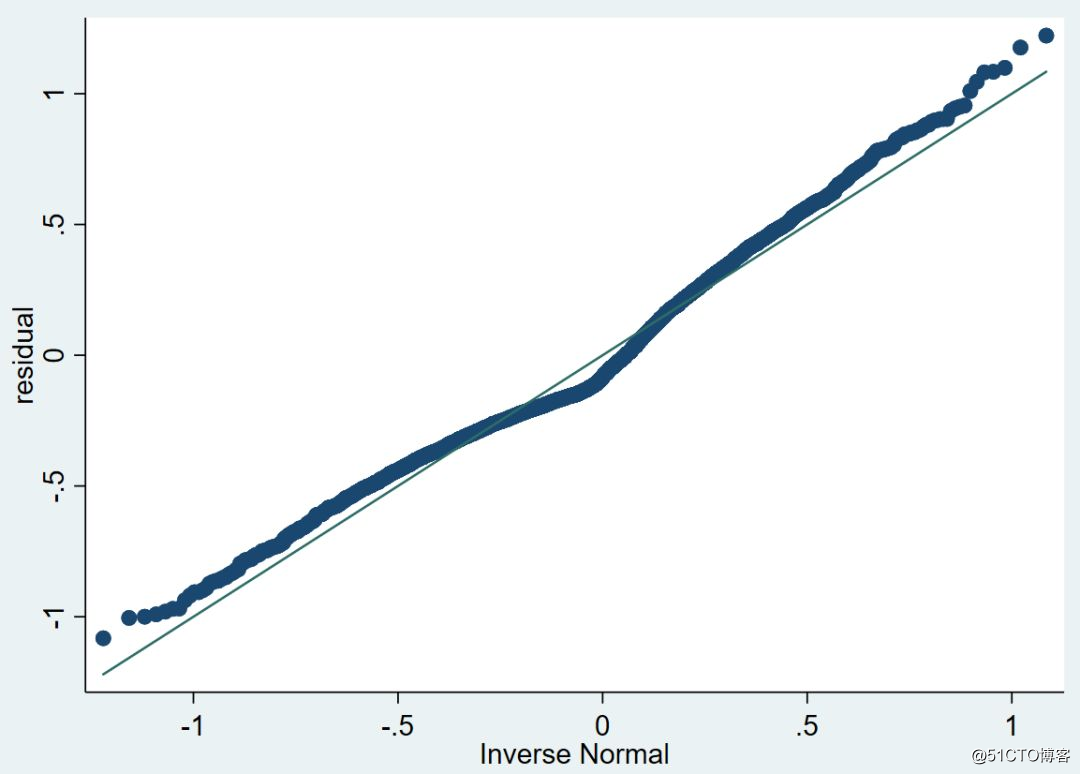
The following is the QQ graph of Tobit's regression residual. We see that this residual is around the 45-degree line, but there is a tendency to deviate from both sides in the lower left and upper right. In fact, when we use sktest to test the statistical value, we find that the residuals of the regression conform to the normal distribution.
Below, we use the clad method to perform the left-end merge regression, and the results of the regression are similar to the results of the Tobit regression. However, what we need to pay attention to is that there is a column of "bias" in this result, so we need to pay more attention to the bias corrected confidence interval, because we also need to obtain information about whether these coefficients are significant.

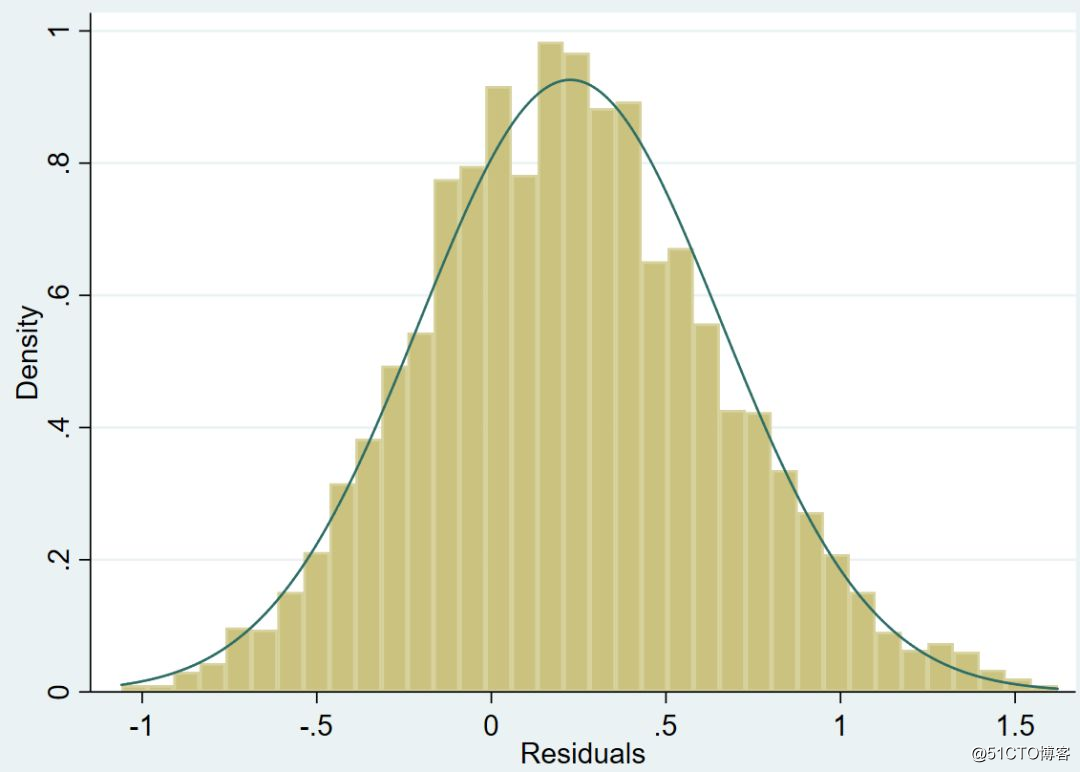
After clad regression, we get the regression residual, and then draw the histogram of the residual and the normal distribution density line. From the figure below, we can see that the current residuals almost perfectly obey the normal distribution. Therefore, the estimated value obtained by clad is obviously better than the estimated value obtained by tobit regression.
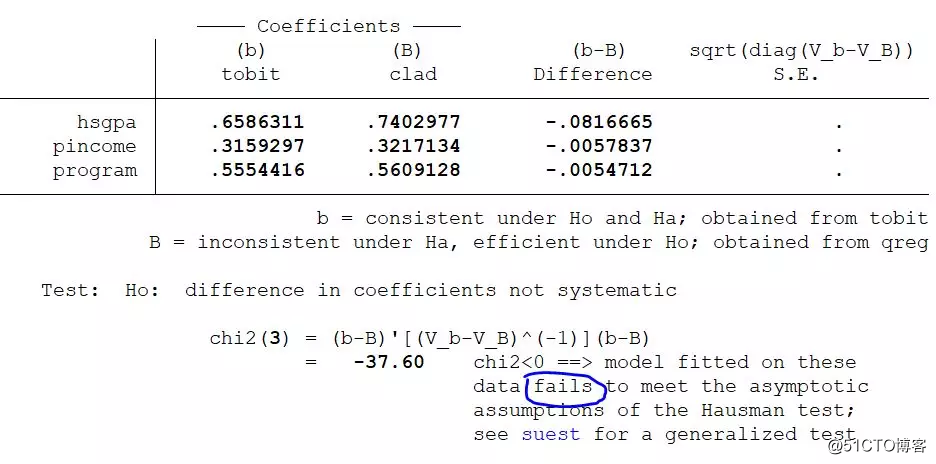
We use hausman to test whether clad is superior to the tobit model. If the results of hausman tobit clad show that the estimated coefficients of the two equations are significantly different, then we recommend that circle friends use the clad model. Unfortunately, in this randomly selected data, the hausman test fails because the chi square turns out to be a negative number. Therefore, it is recommended that we use the suest test. In a general situation, we can give the estimated results of ols, tobit, and clad at the same time, so that we can see how robust our estimated results are.
The clad method currently can only use one-sided merging, and cannot merge both sides at the same time like the tobit model. Below is the estimated result of our right-end merge on the dependent variable y. The results obtained here are also very similar to the previous ones.
In addition, the clad method is the standard error obtained through the bootstrap method. It allows us to use the one-stage bootstrap method to obtain the standard errors, and also allows us to use the two-stage bootstrap method to obtain the standard errors. For example, if we want to grasp the love situation of friends in the econometric circle of a certain province (city) through a sample survey, using multi-stage sampling, then 30 universities in a certain province (city) can be regarded as primary sampling units, that is, primary sampling. unit. Then these 30 universities are our variable identifying resampling clusters.
The following is the result of the two-stage bootstrap.
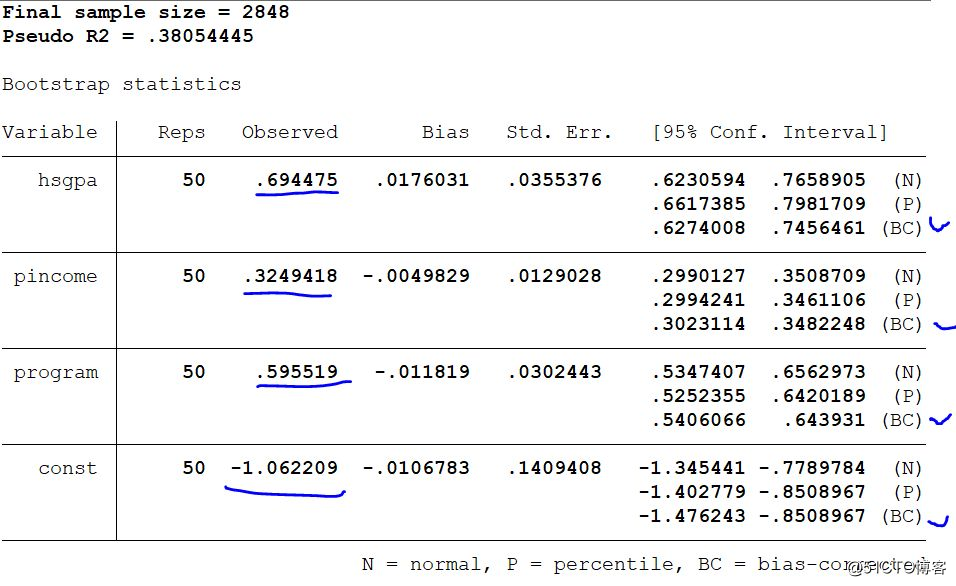
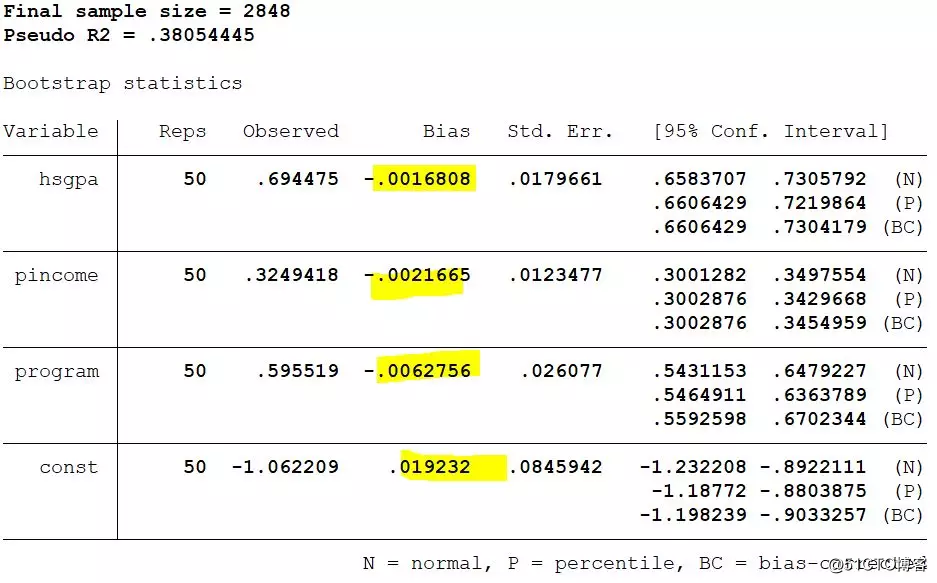
The following is the result of the one-stage bootstrap. What is the difference between the two?
Okay, let's stop here. If you need a do file, please go to the econometric community to get it. You can go to the Micrometrics Research Group of the Econometrics Circle to further visit and exchange various academic issues of micrometrics.