about the author
Jinghailu@薄荷点点点
One piece of Jingdong logistics data PM.
Focusing on "BI+" will take you to discover more possibilities of data products.
In the recent period of time, according to the technical trends of BI systems and data analysis in Gartner related reports, some generalizations have been made. For some trend points, we have deliberately searched for existing BI products. Standing at the beginning of 2021, let us Let's get down to earth!
1 Analysis time
Analysis moment is a data analysis process defined by Gartner. It supports the delivery of business results by visualizing, exploring, and applying algorithms to data, so as to make better or faster decisions and automate business processes.
With the gradual reduction of the threshold for data use, self-service and platform-based BI has become a trend, and the initiative of data analysis will gradually be transferred to the hands of business personnel. Data analysis is directly initiated by business personnel who encounter business problems, and business personnel can use data analysis tools /The platform completes the data analysis content.
For example:
When a business person wants to know the online sales forecast of a certain product, or why the goods in the shopping cart are not converted into purchases by certain customers, in the past, the business person had to turn to a professional data analyst in the IT department ( Extract potentially relevant data and output specific analysis reports), data scientists (build predictive models), but imagine that if commonly used predictive algorithm models and attribution analysis tools are established in the BI system, you can easily connect data sets and business personnel Complete the analysis content independently and quickly. Through self-service analysis, he quickly knows these data conclusions or the cause of the problem, so as to make business feedback.
2 Enhanced analysis
Enhanced analysis mainly refers to data analysis and BI functions based on machine learning. Through the application of machine learning, artificial intelligence and other technologies, common and general data analysis scenarios are precipitated into product functions to help ordinary users without data science experts or Complete data analysis with the assistance of IT personnel.
The underlying concept of enhanced analysis is "easy to use", which can support users to complete the entire process of "collection-preparation-integration and analysis" of data without the background of professional knowledge.
Enhanced analysis includes modules such as enhanced data preparation, enhanced machine learning, and enhanced data analysis. Here we mainly talk about the application trend in data analysis.
(1) Application of NLP and NLG
Use natural language analysis (NLP) to analyze data through language and visualization
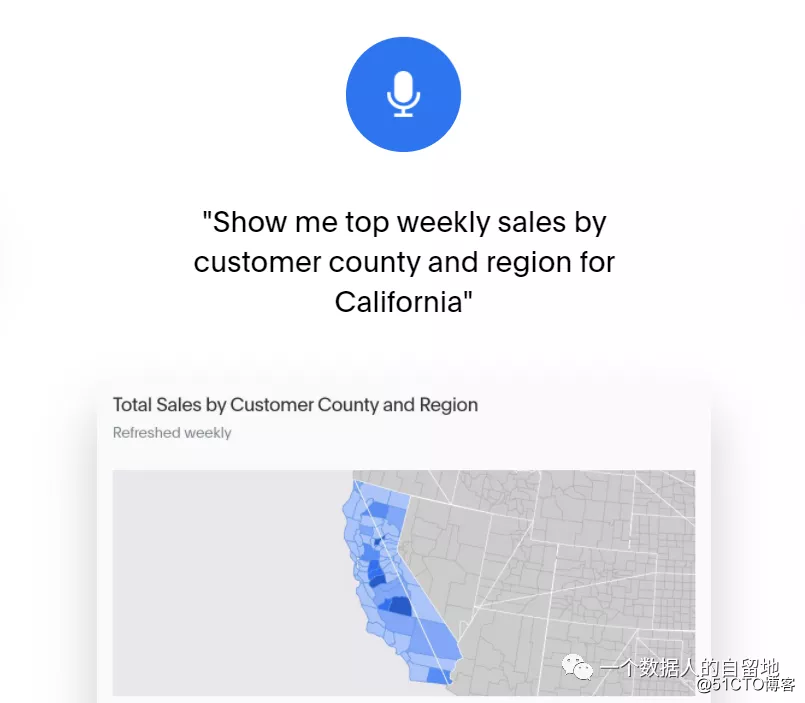
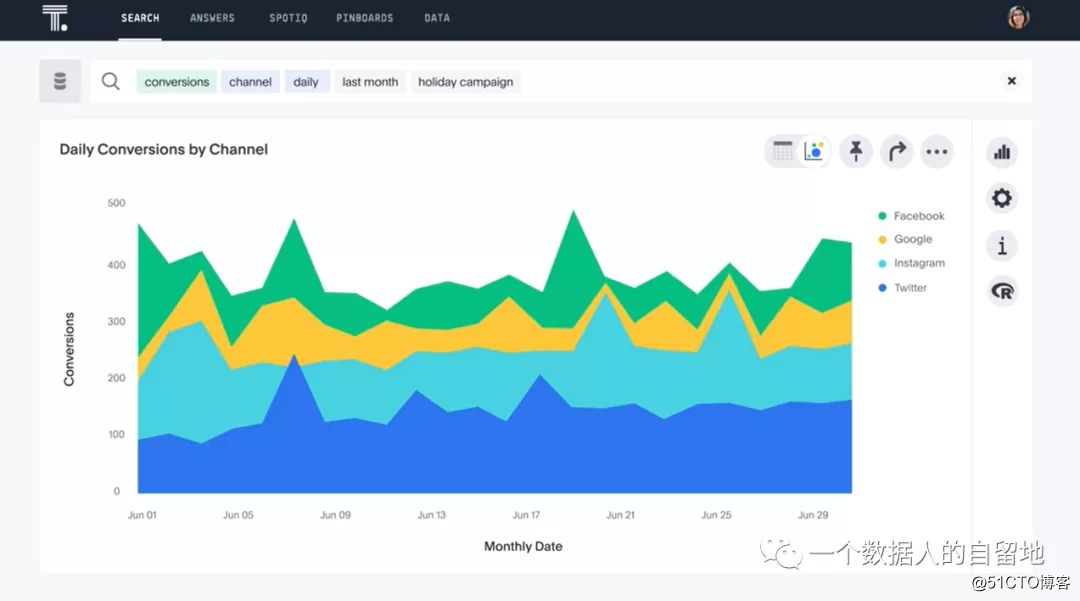
Example: ThoughtSpot uses search and NLP as the main interface for accessing data. Users can ask questions through typing or voice.
Data robot for conversational data analysis
The natural language is transformed into SQL, and the SQL result set is transformed into a visual graph, forming a complete link of "NL2SQL2Graph".
Example: Ali Xiaomi (Entrance: Taobao)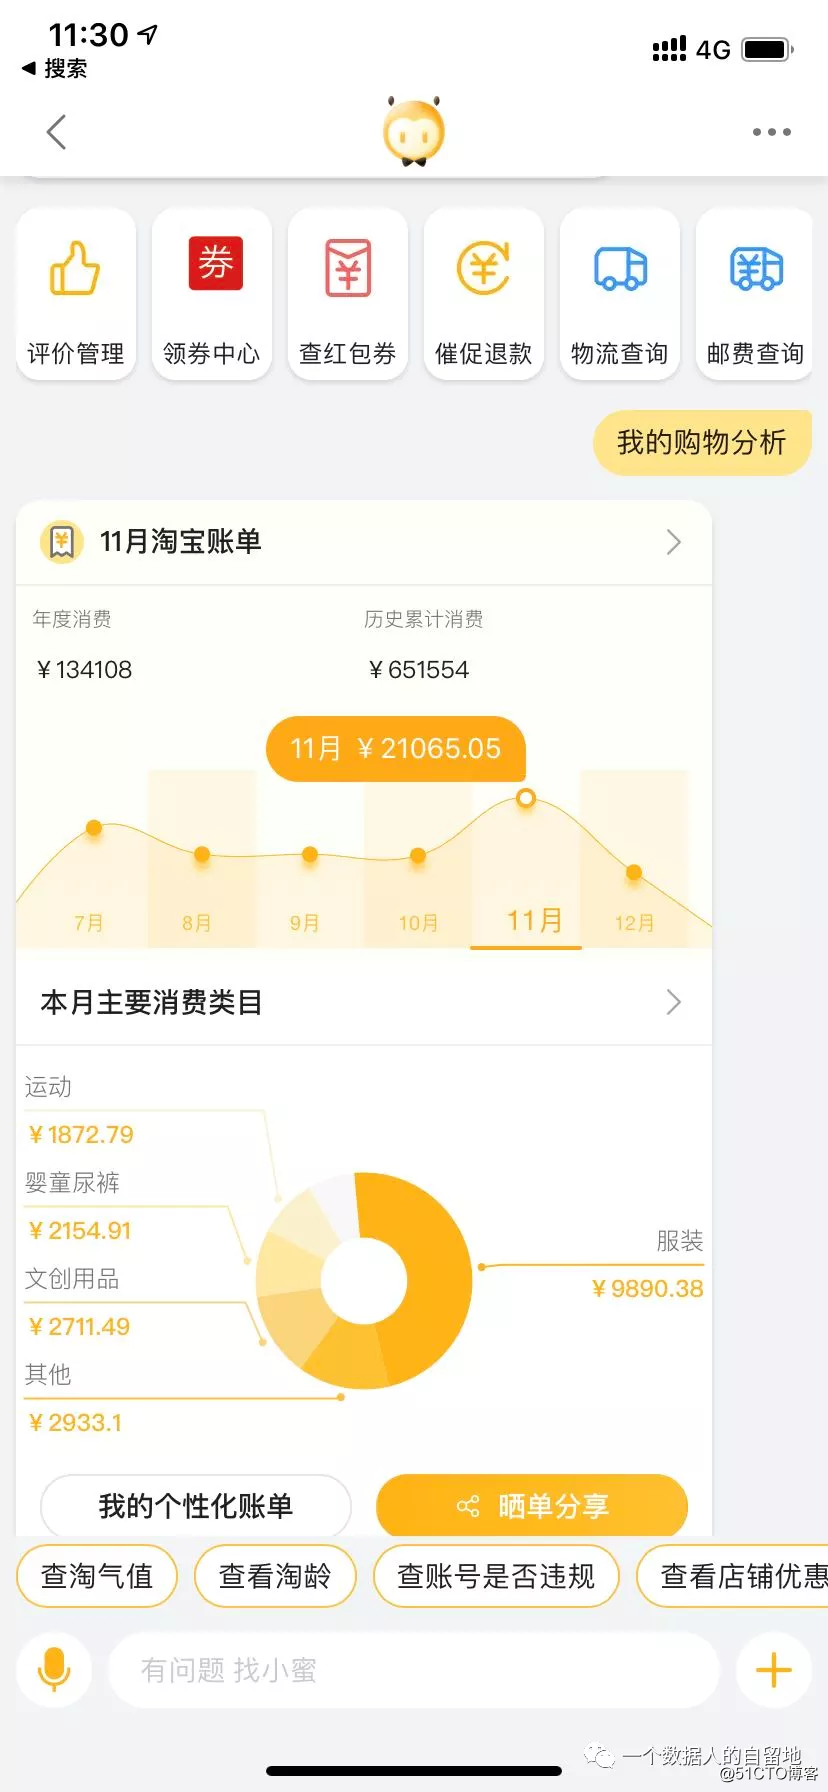
Use natural language generation (NLG) to present the opinions and conclusions analyzed by the machine to users in language
Example: Tableau's explain Data function will automatically provide AI-driven explanations for selected values. This function checks hundreds of possible explanations in the background and presents the most likely explanations.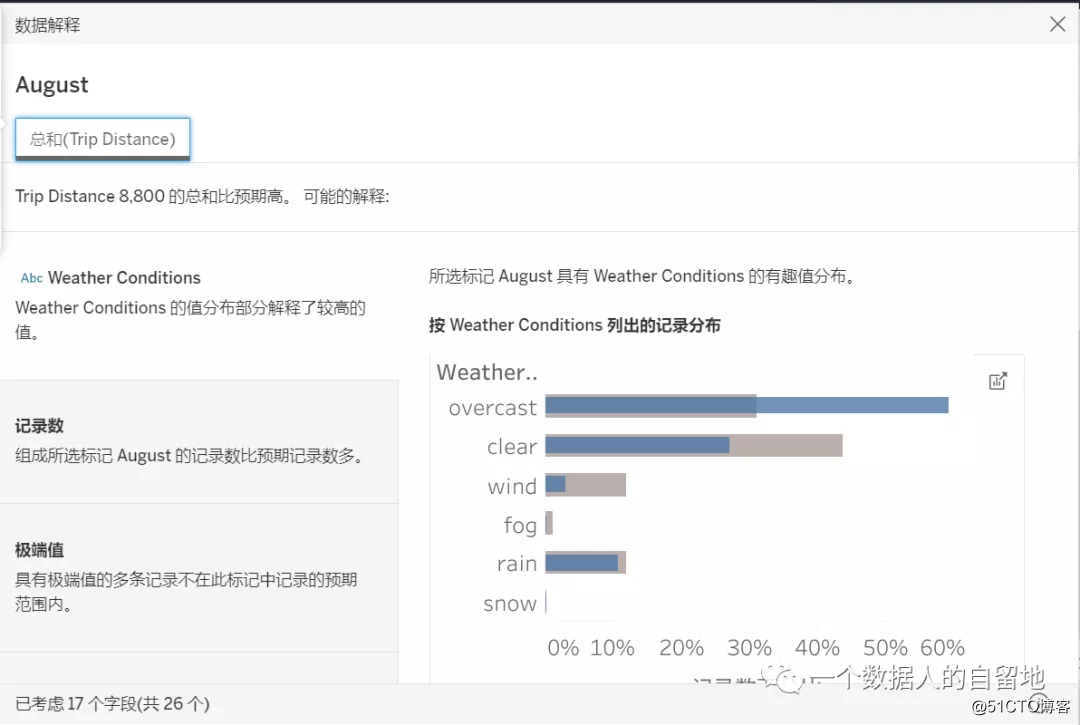
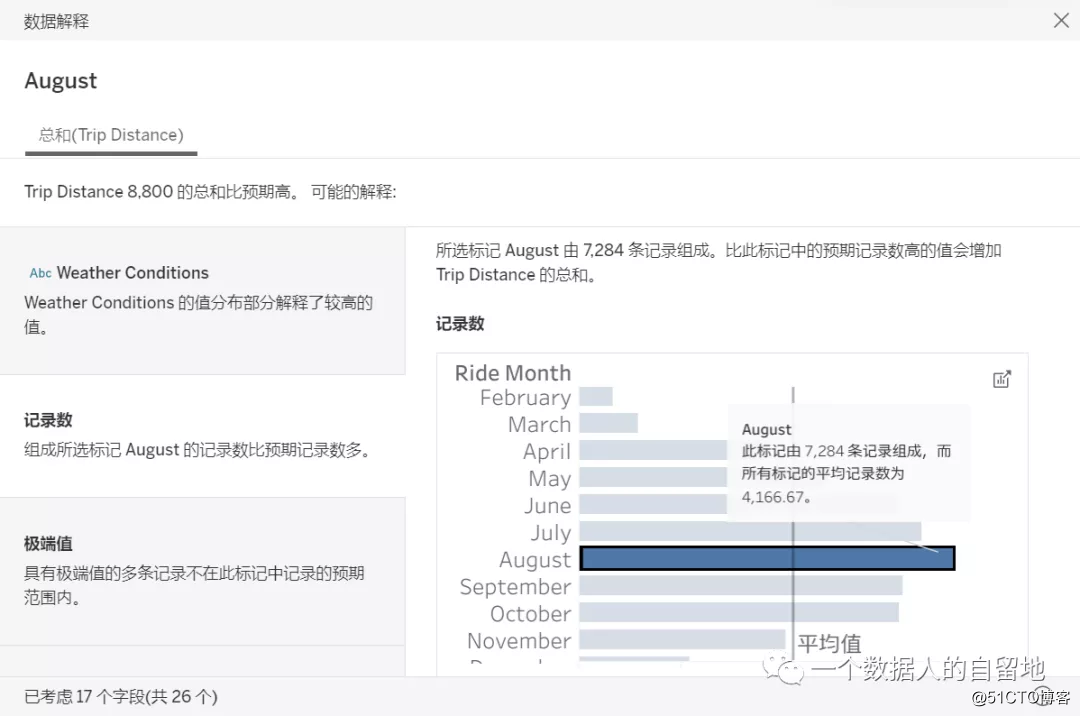
How is this function implemented? The introduction of explain data performance enhancement in the 2020.2 new feature webinar of tableau let us roughly know the operating principle:
When you click on a data value to explain data, the system will automatically cross-calculate each dimension and each measure of the data set to determine whether the data value to be explained is higher or lower than the expected (mean).
Taking higher than expected as an example, explain data will try to do the following types of explanations:
First scan all the dimension information to see if there is a significant dimension (the value of this dimension is generally high);
Then check the number of records (number of data), whether it is caused by the high number of data records;
Again, consider the extreme value, whether it is due to an extreme value that caused the high.
In the new version of explain data, the range of calculated dimensions is limited (all dimensions are no longer parsed, some dimensions with obvious values too many, and dimensions containing the average value will be ignored by default), which can solve the previous data Explain data will be slower if the set is large or the dimension is too large.
(2) Automatic insight and automatic visualization
Automated insights
Automatic insight means that the machine automatically discovers potential information and value from the data: discovers the associations between the data, discovers data anomalies, and automatically clusters.
Most mainstream BI platforms now have automatic insight related functions launched. For example:
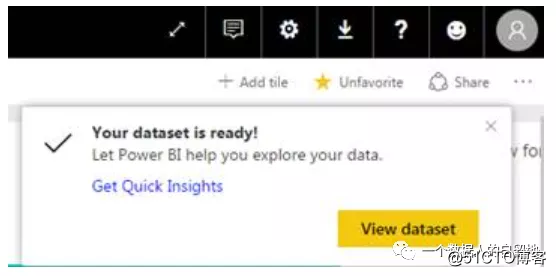
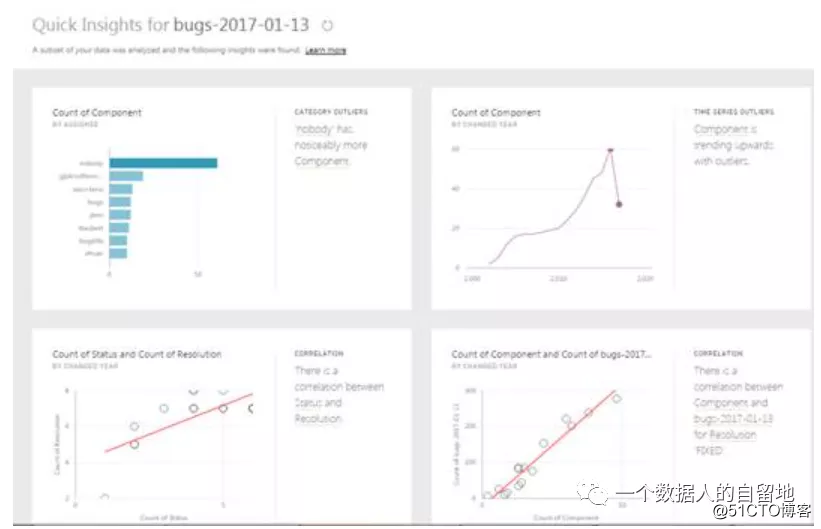
The Quick Insights function of Microsoft's PowerBI can automatically make a variety of cross first-order or multi-order calculations (percentage, ranking, same chain ratio) for the source data, thereby mining various trends within the data.
Automated visualization
According to the data results, the visualization method is automatically selected for display, so as to clearly display the data analysis results.
There are 2 directions:
Automatic chart selection: When the data set is queried, the machine will automatically generate a suitable chart according to the characteristics of the data. Chart automation is now supported by mainstream BI tools, such as tableau. After selecting a data set, the first thing you see is not the data, but the automatic visualization chart. When the dimensions increase, the existing chart will be automatically split. Divide into multiple.
Automatic report generation: higher than automatic chart selection, automatic generation of report layout, configuration controls, chart linkage, etc.
Technically, there are two realization ideas:
Rule-based: The rule base is set up in advance, and charts are generated according to the rules. The quality of the rule base is the key.
Model-based: To transform a problem into a classification or sorting problem, the characteristics of the data itself and the characteristics of the visualization chart are the key.
3 Embedded analysis
Integrate specific data analysis methods into business systems.
For example, the page of the BI system can be used to be embedded in other systems, which is very good for the future development of the product:
Can expand the scope of application of BI and facilitate future product planning upgrades
Business personnel can see the analysis results of the data in the system that generates the data, which increases the experience, and the process and experience are very smooth.
Forecast and decision-making recommendations
The business experience summarized through a large number of manual business analysis, coupled with the blessing of AI and machine learning technology, allows the machine to complete business analysis and action recommendations at one time.
For example: Taobao's business staff, the data phenomenon is followed by operation suggestions and business skills.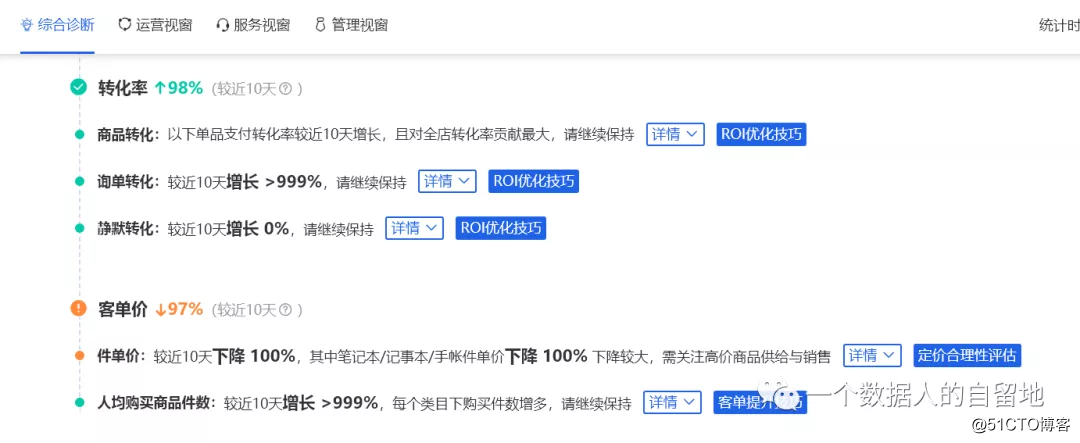
How to realize this function? It looks very tall, but there is actually a simple way to say it:
First, extract the business scenario behind the data performance, judge which business scenario it belongs to based on the data performance, and then push out the corresponding explanations and suggestions. The feature of this implementation method is that the business is relatively mature and can be well abstracted. The relationship between business data and strategy. The use of rules in implementation can well meet the initial needs. Yes, the focus is to sort out the corresponding rule base.
I personally recommend this kind of low-cost decision-making suggestions, which can achieve better results in the initial short-term of the project and provide good ROI support for future iterative upgrades.
Reference materials:
《Quick Insights With Power BI》(Madan Bhintade,C#Corner)
"Principles and Practice of Enhanced Analysis Technology" (Ma Yue, Ding Jiandong Alibaba, DataFunTalk)
"Gartner's Recommendations for Building a Data Center"
Tableau China official website
ThoughtSpot official website
The private place of a data person is a big family that helps the data person grow, helping partners who are interested in data to clarify the learning direction and accurately improve their skills. Follow me and take you to explore the magical mysteries of data
1. Go back to "Data Products" and get <Interview Questions for Data Products from Big Factory>
2. Go back to "Data Center" and get <Dachang Data Center Information>
3. Go back to "Business Analysis" and get <Dachang Business Analysis Interview Questions>;
4. Go back to "make friends", join the exchange group, and get to know more data partners.