Seaborn is based matplotlib Python data visualization library. It provides a high-level interface for statistical graphics rendering and rich compelling content.
1. Install
You can pipinstall the latest version seaborn:
pip install seaborn
You can also be used condato install the released version:
conda install seaborn
In addition, you can use pipdirectly from the githubinstallation development version:
pip install git+https://github.com/mwaskom/seaborn.git
Another option is to clone github repository and install a local copy:
pip install .
Note seaborn dependencies :
- Python 3.6+
- numpy (>= 1.13.3)
- scipy (>= 1.0.1)
- pandas (>= 0.22.0)
- matplotlib (>= 2.1.2)
2. seaborn contrast with matplotlib
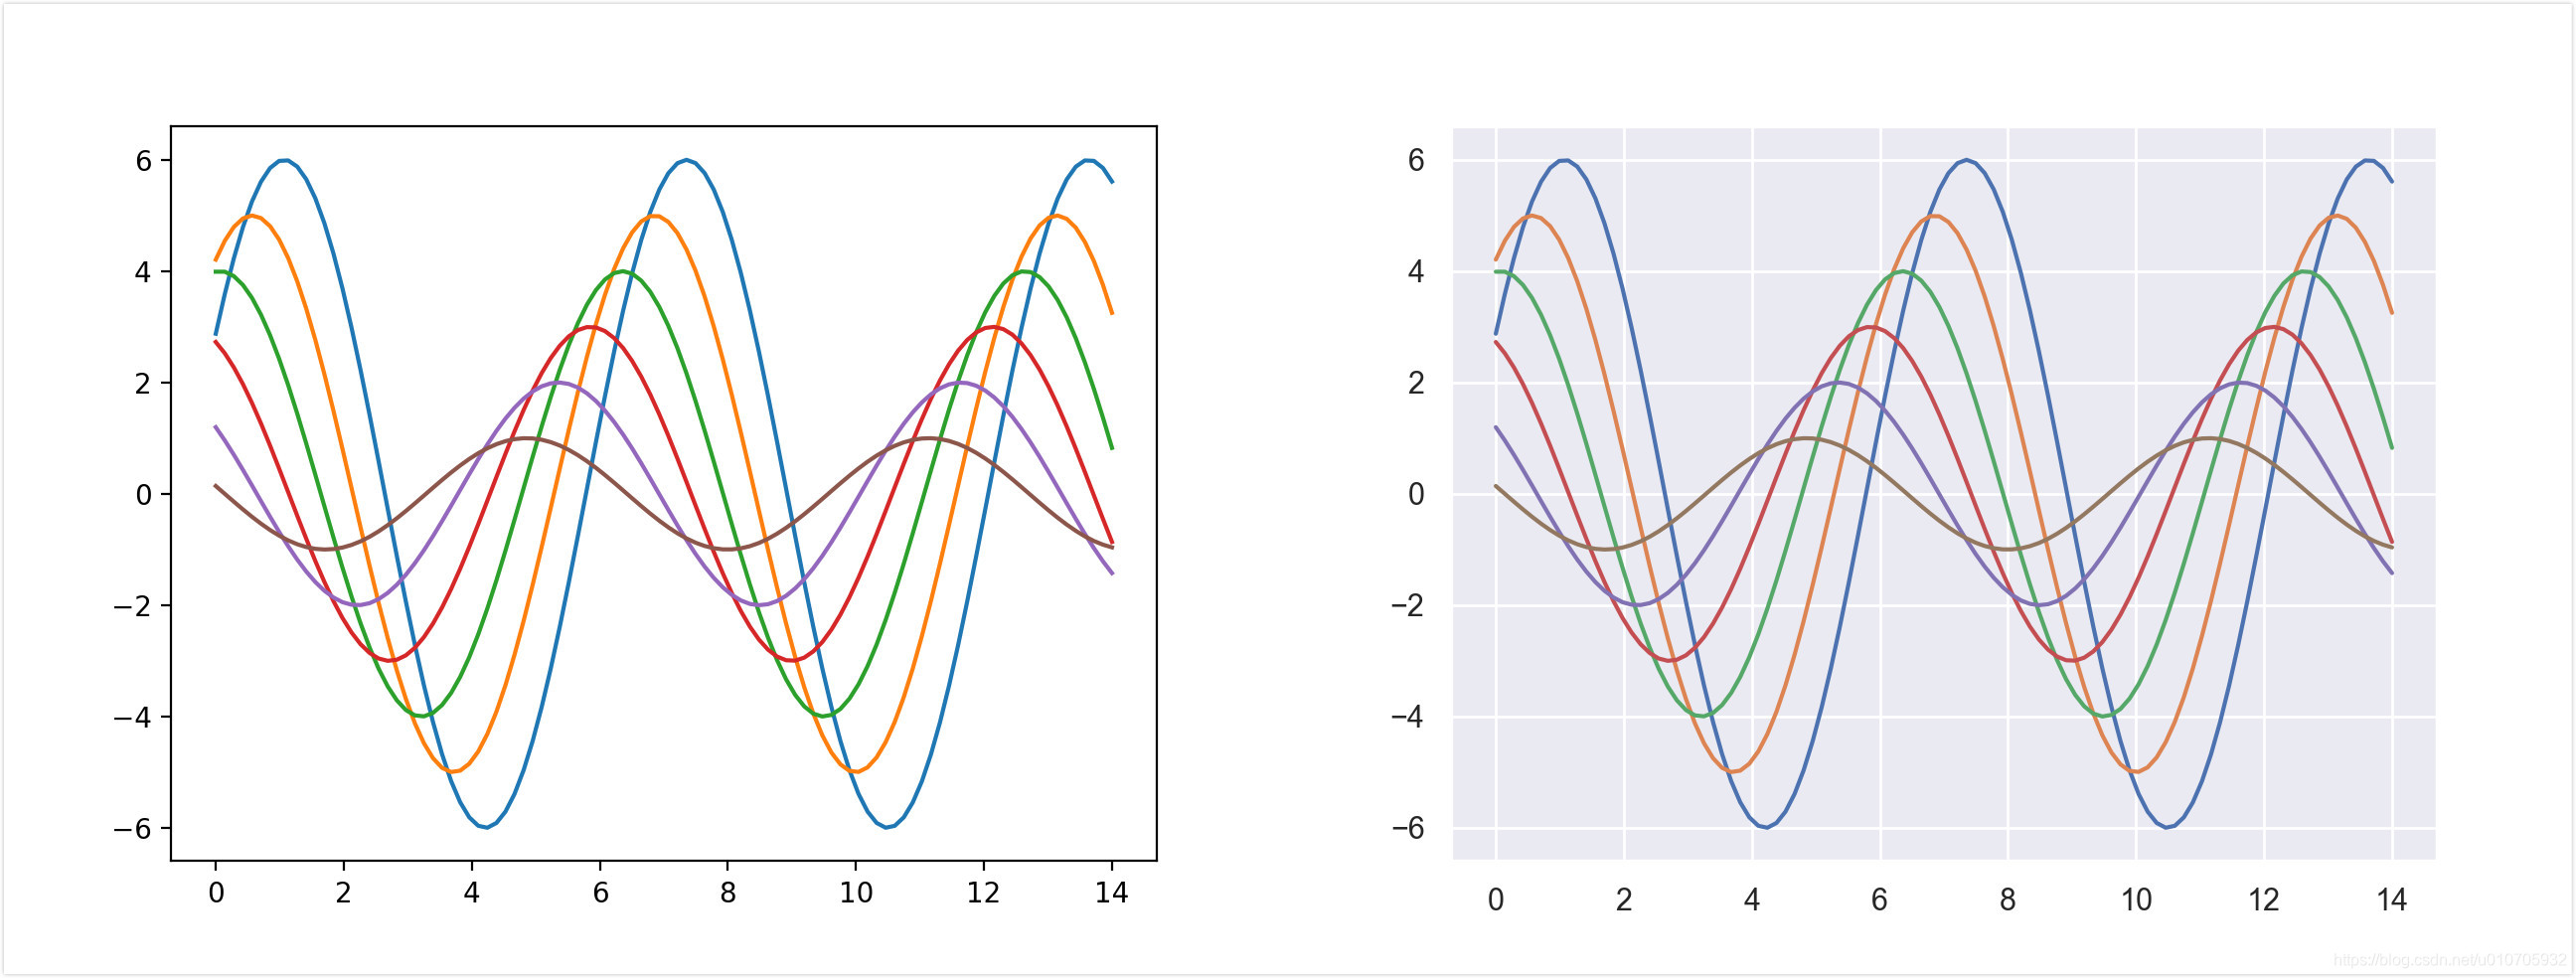
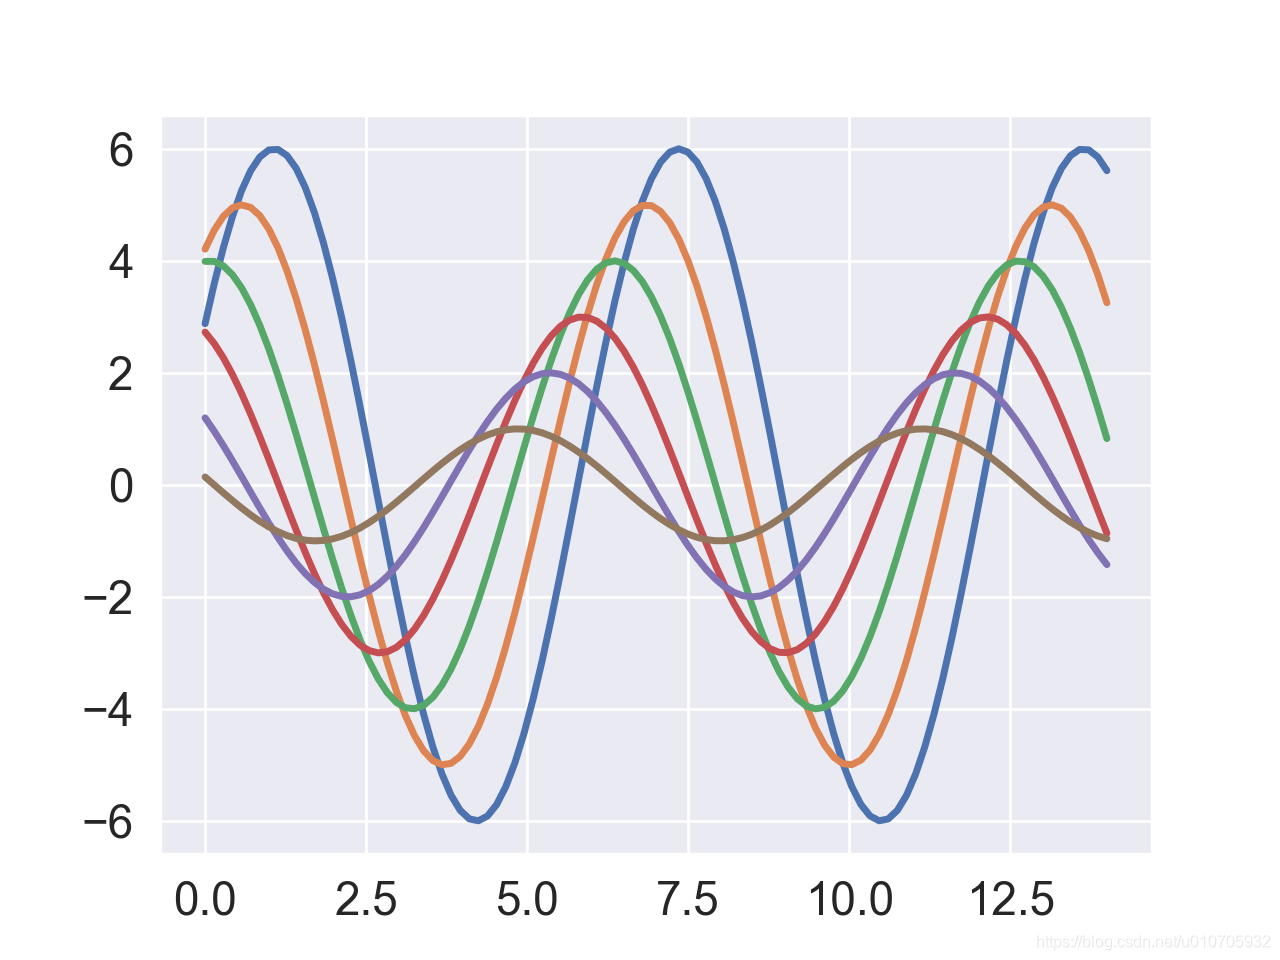
Let's define a simple function to draw some offset sine wave, simply compare different styles and matplotlib through its seaborn. Seaborn switch to the default value, simply call the set()function.
import numpy as np
import seaborn as sns
import matplotlib.pyplot as plt

# matplotlib or seaborn
style = 'seaborn'


def sinplot(flip=1):
    x = np.linspace(0, 14, 100)
    for i in range(1, 7):
        plt.plot(x, np.sin(x + i * .5) * (7 - i) * flip)


if style == 'matplotlib':
    sinplot()
else:
    sns.set()
    sinplot()

plt.show()
The left is matplotlib graphics in the case of default, the right is the graphic in seaborn by default:
The parameters Seaborn matplotlib into two separate groups. Setting a first set of aesthetic style of the plot, a second set of scaling various graphic elements, so that it can easily be incorporated into a different context.
Manipulate these parameters are two pairs of interface function. To control the style, use axes_style () and set_style () function. To scale drawing, using plotting_context () and set_context () function. In both cases, the function returns a dictionary, the second function provided matplotlib default value.
3. style settings
3.1 theme settings
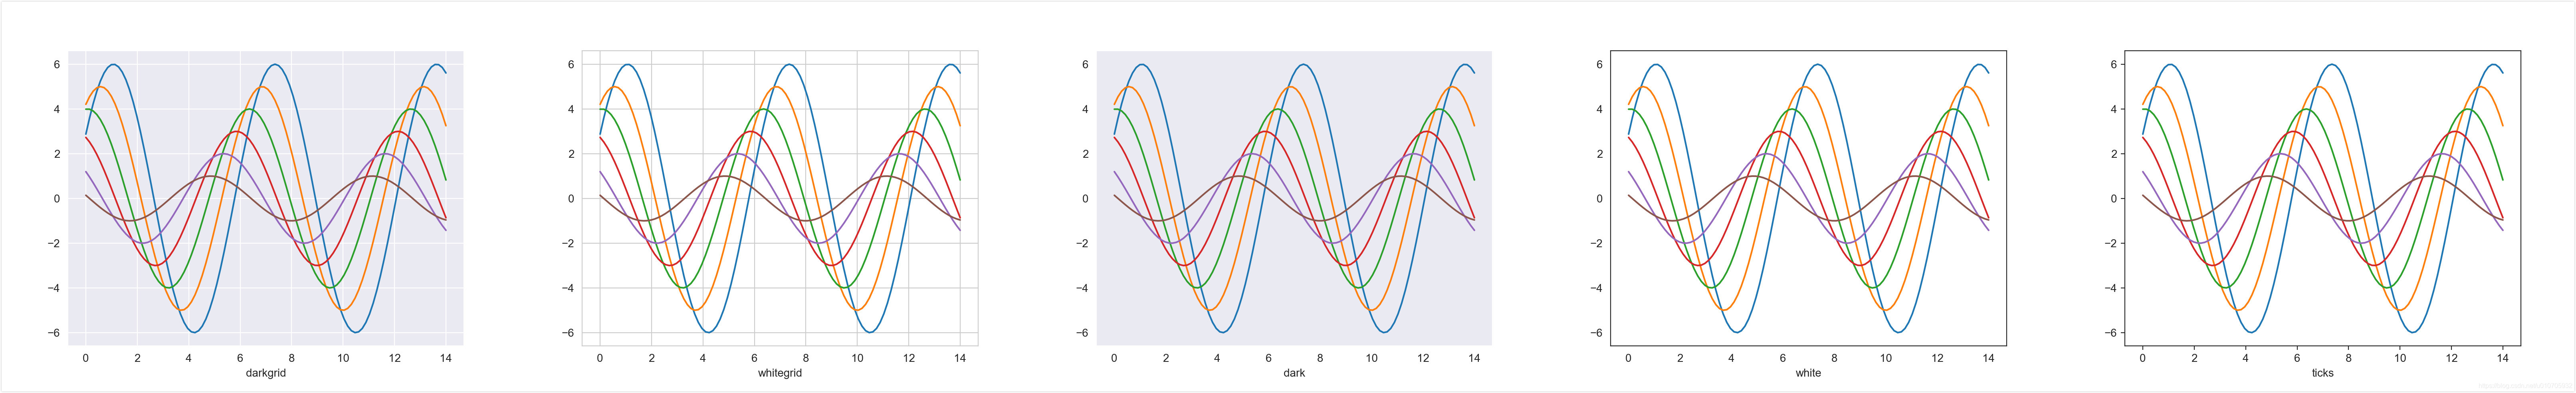
seaborn preset five kinds of theme styles: (default),darkgrid , , , . They will affect the axis color, grid is enabled and other aesthetic elements.whitegriddarkwhiteticks
import numpy as np
import seaborn as sns
import matplotlib.pyplot as plt


def sinplot(flip=1):
    x = np.linspace(0, 14, 100)
    for i in range(1, 7):
        plt.plot(x, np.sin(x + i * .5) * (7 - i) * flip)


# five theme: darkgrid, whitegrid, dark, white, and ticks.
styles = ['darkgrid', 'whitegrid', 'dark', 'white', 'ticks']
select_style = styles[4]
sns.set_style(select_style)
sinplot()
plt.xlabel(select_style)
plt.show()
3.2 shaft is provided
white theme and style can remove unwanted ticks on and right shafts, by calling seaborn the despine()realization function.
import numpy as np
import seaborn as sns
import matplotlib.pyplot as plt


def sinplot(flip=1):
    x = np.linspace(0, 14, 100)
    for i in range(1, 7):
        plt.plot(x, np.sin(x + i * .5) * (7 - i) * flip)


styles = ['white', 'ticks']
select_style = styles[1]
sns.set_style(select_style)
sinplot()
# remove axes spines
sns.despine()
plt.xlabel(select_style)
plt.show()
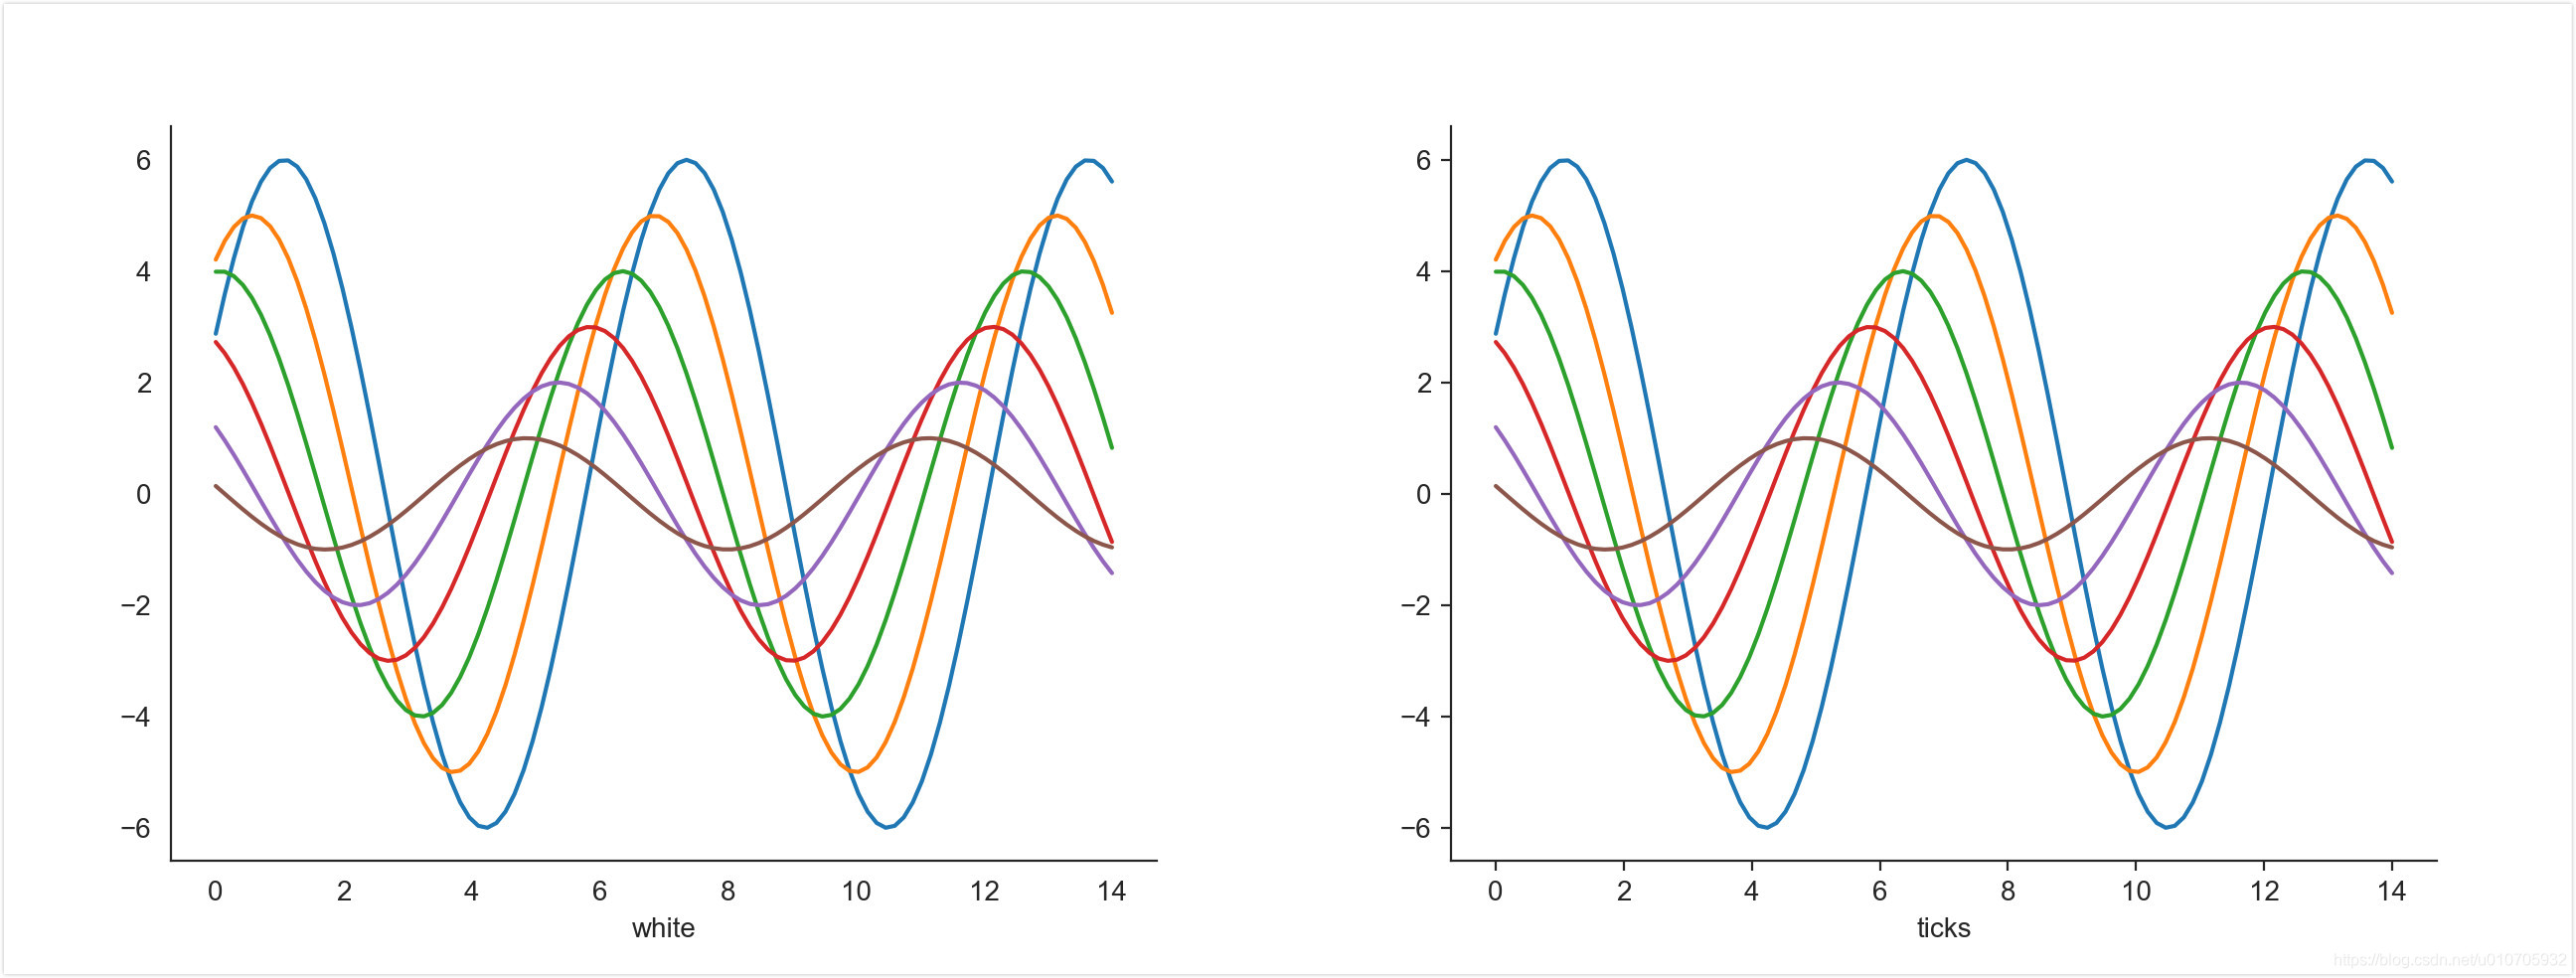
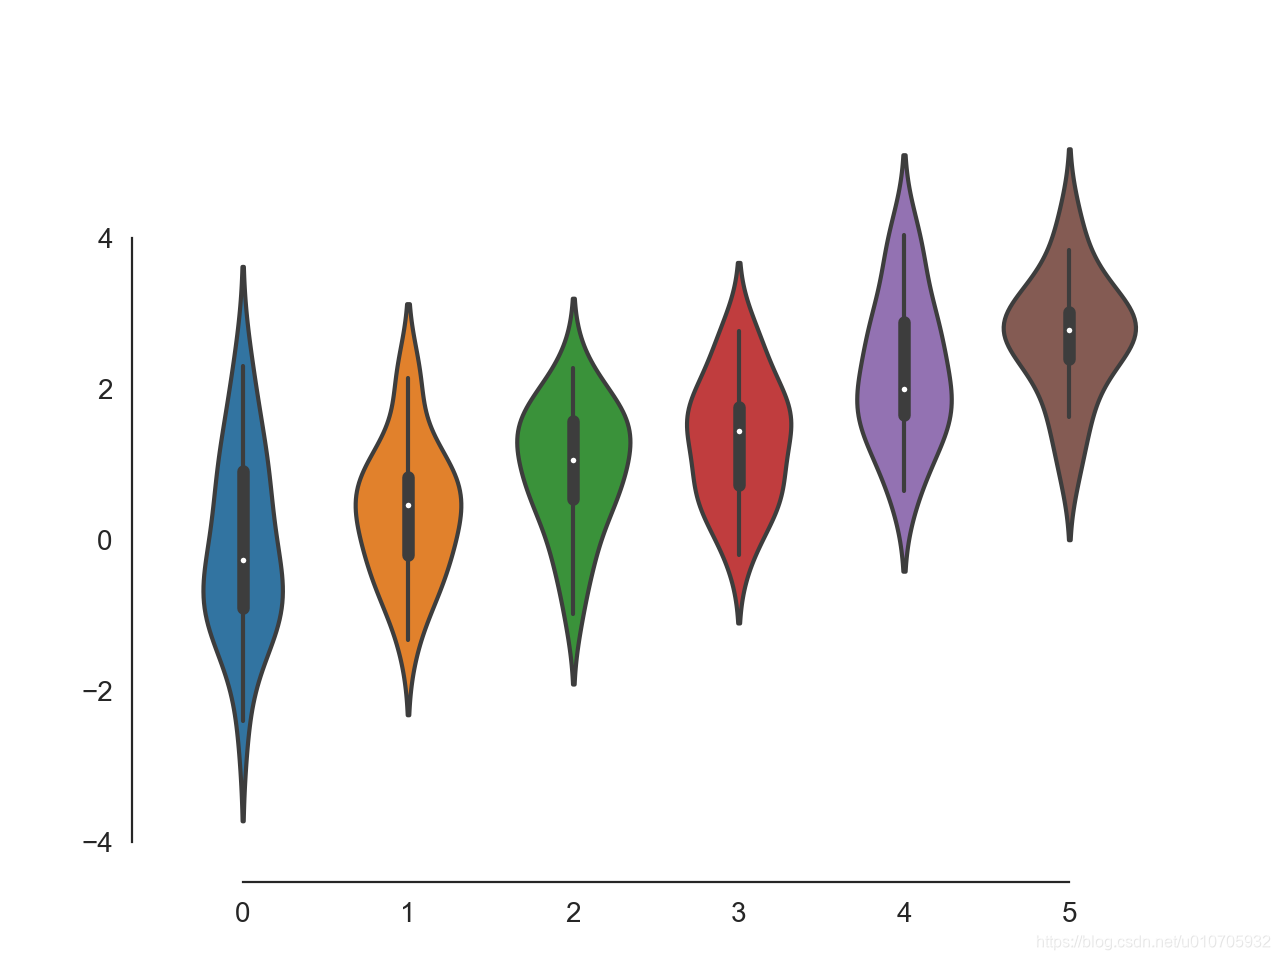
FIG. Some data may be offset from the axis, which can also be called despine () is completed. When the scale not cover the entire range of the axis, trimparameter limit the scope of the shaft.
import numpy as np
import seaborn as sns
import matplotlib.pyplot as plt

sns.set_style("white")
data = np.random.normal(size=(20, 6)) + np.arange(6) / 2
f, ax = plt.subplots()
sns.violinplot(data=data)
# offset and trim
sns.despine(offset=10, trim=True)
plt.show()
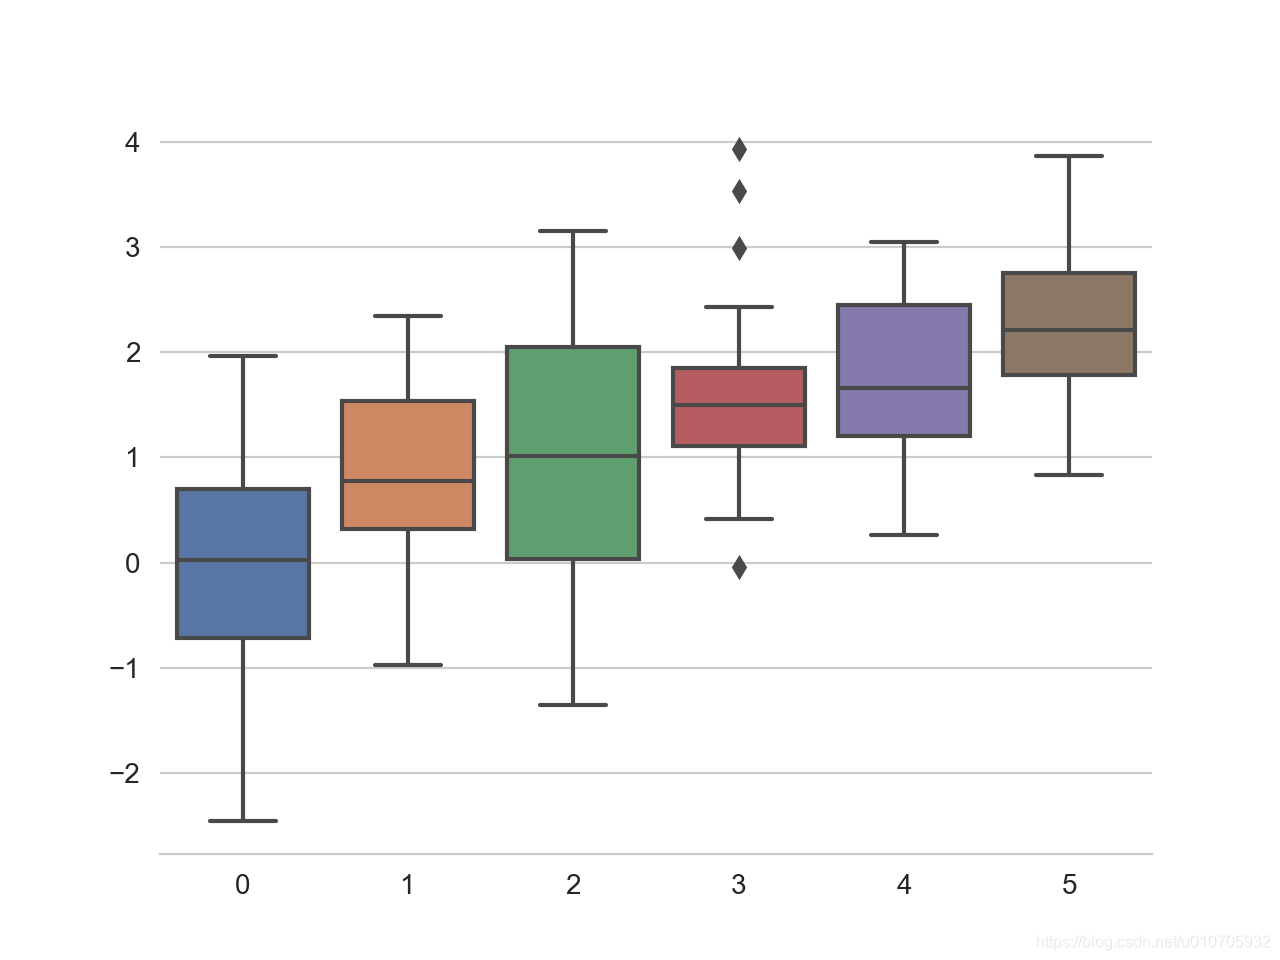
It may also be used despine () is an additional parameter which controls the axis deleted.
import numpy as np
import seaborn as sns
import matplotlib.pyplot as plt

sns.set_style("whitegrid")
data = np.random.normal(size=(20, 6)) + np.arange(6) / 2
sns.boxplot(data=data, palette="deep")
# remove which spines: top, right, left, bottom
sns.despine(left=True)
plt.show()
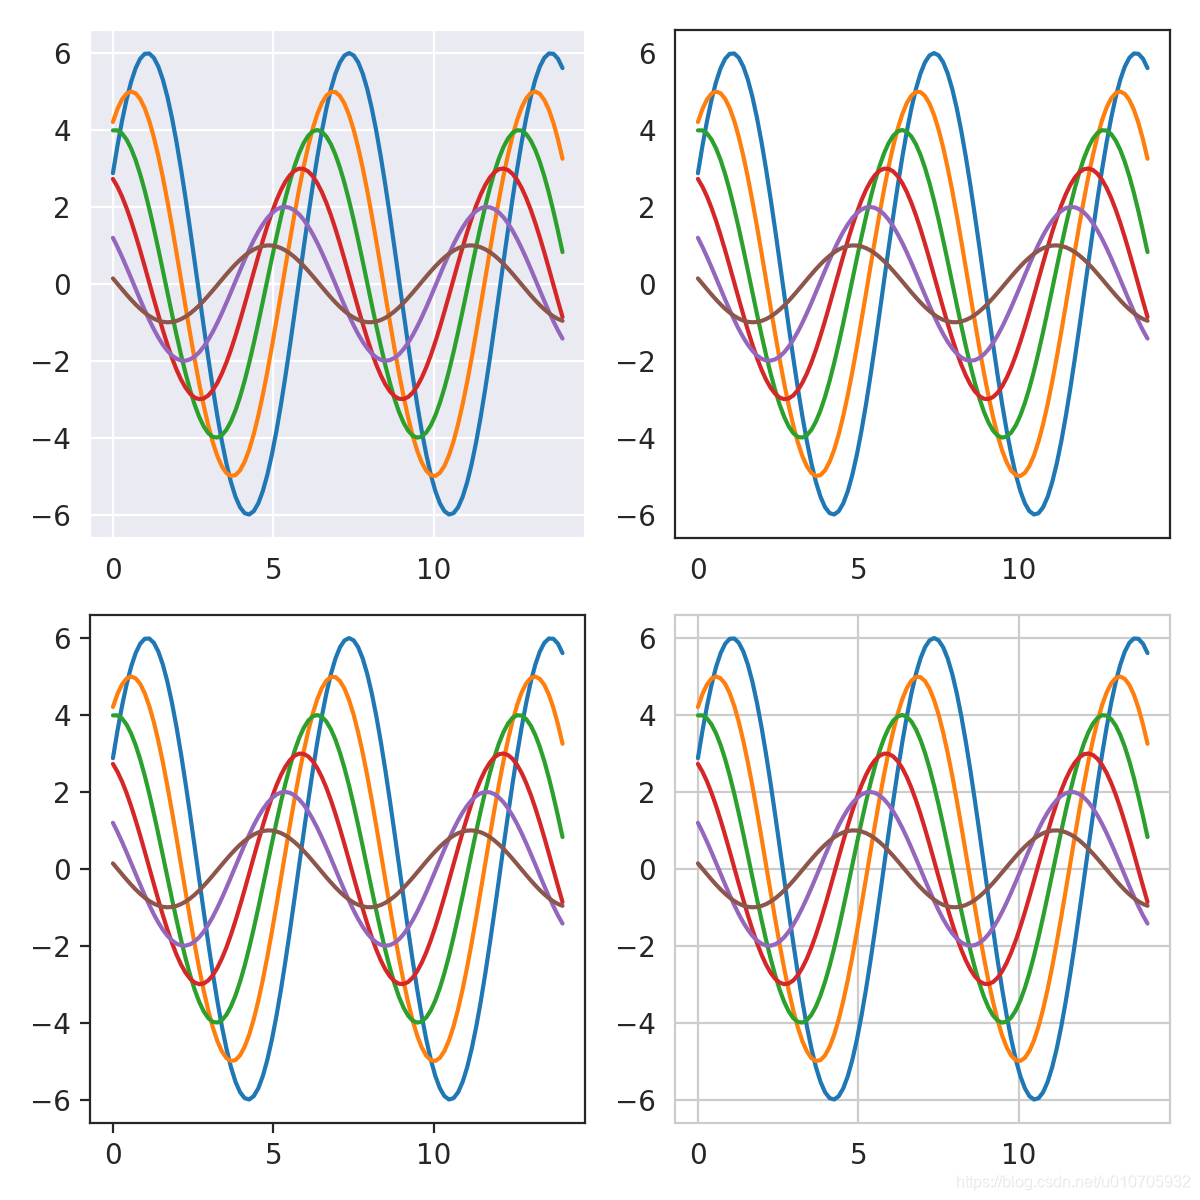
3.3 Temporary settings graphic style
Although it is easy to switch back and forth, but can also be used with statement axes_style () function to temporarily set the drawing parameters. This also allows you to use graphical axes to make different styles:
import numpy as np
import seaborn as sns
import matplotlib.pyplot as plt


def sinplot(flip=1):
    x = np.linspace(0, 14, 100)
    for i in range(1, 7):
        plt.plot(x, np.sin(x + i * .5) * (7 - i) * flip)


f = plt.figure(figsize=(6, 6))
gs = f.add_gridspec(2, 2)

with sns.axes_style("darkgrid"):
    ax = f.add_subplot(gs[0, 0])
    sinplot()

with sns.axes_style("white"):
    ax = f.add_subplot(gs[0, 1])
    sinplot()

with sns.axes_style("ticks"):
    ax = f.add_subplot(gs[1, 0])
    sinplot()

with sns.axes_style("whitegrid"):
    ax = f.add_subplot(gs[1, 1])
    sinplot()

f.tight_layout()
plt.show()
3.4 Rewrite seaborn style
If you want to customize seaborn style, parameters can be passed to the dictionary axes_style () and set_style () is rc parameters. Please note that the parameters fall within the definition part of the style can only be overridden by this method. (However, more advanced set () function takes any dictionary matplotlib parameters).
If you want to see which parameters include, simply call the function with no parameters, it returns the current setting:
sns.axes_style()
{'axes.facecolor': 'white',
 'axes.edgecolor': '.8',
 'axes.grid': True,
 'axes.axisbelow': True,
 'axes.labelcolor': '.15',
 'figure.facecolor': 'white',
 'grid.color': '.8',
 'grid.linestyle': '-',
 'text.color': '.15',
 'xtick.color': '.15',
 'ytick.color': '.15',
 'xtick.direction': 'out',
 'ytick.direction': 'out',
 'lines.solid_capstyle': 'round',
 'patch.edgecolor': 'w',
 'image.cmap': 'rocket',
 'font.family': ['sans-serif'],
 'font.sans-serif': ['Arial',
  'DejaVu Sans',
  'Liberation Sans',
  'Bitstream Vera Sans',
  'sans-serif'],
 'patch.force_edgecolor': True,
 'xtick.bottom': False,
 'xtick.top': False,
 'ytick.left': False,
 'ytick.right': False,
 'axes.spines.left': True,
 'axes.spines.bottom': True,
 'axes.spines.right': True,
 'axes.spines.top': True}
You can then set up different versions of these parameters:
import numpy as np
import seaborn as sns
import matplotlib.pyplot as plt


def sinplot(flip=1):
    x = np.linspace(0, 14, 100)
    for i in range(1, 7):
        plt.plot(x, np.sin(x + i * .5) * (7 - i) * flip)


sns.set_style("darkgrid", {"axes.facecolor": ".9"})
sinplot()
plt.show()
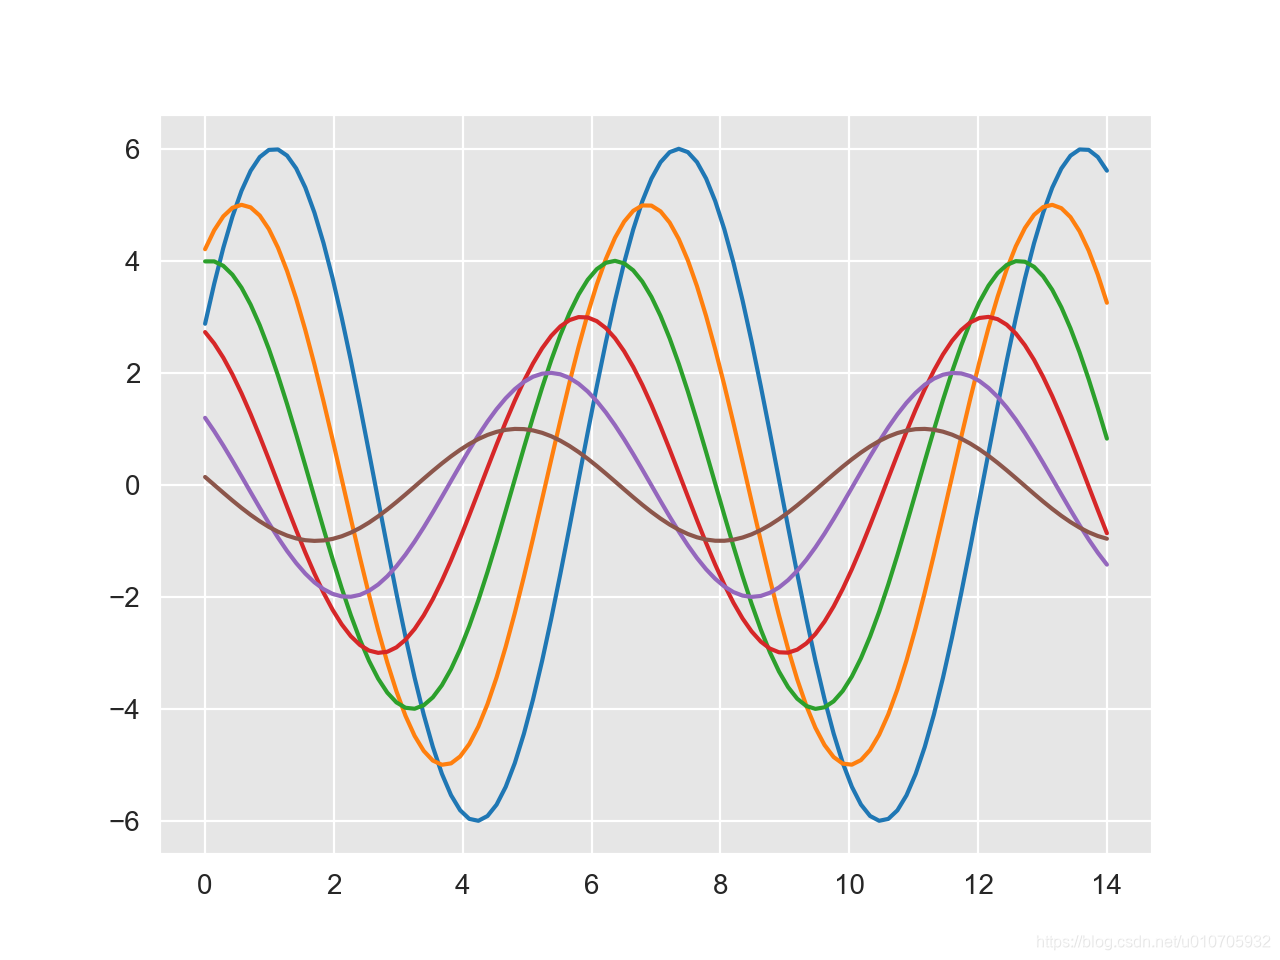
3.5 scale elements
A separate set of parameters to control the ratio of drawing elements, which will allow you to use the same code can be applied to production of larger or smaller drawing settings.
Four default context, according to the relative order of magnitude paper(the notebookdefault),talk , poster, .
import numpy as np
import seaborn as sns
import matplotlib.pyplot as plt


def sinplot(flip=1):
    x = np.linspace(0, 14, 100)
    for i in range(1, 7):
        plt.plot(x, np.sin(x + i * .5) * (7 - i) * flip)


# scaling plot elements
contexts = ['paper', 'notebook', 'talk', 'poster']
select_context = contexts[3]
sns.set()
sns.set_context(select_context)
sinplot()
plt.title(select_context)
plt.show()

You can use one of these names to call set_context () to set the parameters, and the parameters can be overridden by providing parameter values dictionary.
You can also independently scaling the size of the font element when changing context. (This option is also available through top-level set () function to achieve).
import numpy as np
import seaborn as sns
import matplotlib.pyplot as plt


def sinplot(flip=1):
    x = np.linspace(0, 14, 100)
    for i in range(1, 7):
        plt.plot(x, np.sin(x + i * .5) * (7 - i) * flip)


sns.set()
sns.set_context("notebook", font_scale=1.5, rc={"lines.linewidth": 2.5})
sinplot()
plt.show()
Similarly, you can use the withstatement to temporarily control nested drawing scale.
Using the set () functions can be quickly configured styles and contexts. This function can also set the default palette.
4. Set Color
Color is more important than other aspects of the graphic style, as if the effective use of color, the color can display patterns in the data, and if the use is not sufficient, the color can hide these modes. There are many great resources to learn good technique to use color in the visualization, which can be viewed Rob Simmon written by series of blog articles and more technical articles . matplotlib document now there is a good tutorial that explains some of the built-in color chart perception properties.
By Seaborn, you can easily select and use appropriate data types and visualization of target you are using the palette.
4.1 Construction of the palette
The most important function of discrete palette is color_palette () . This function is generated in the color seaborn many (though not all) possible approach provides an interface, and it has been any paletteuse of an internal function parameters (in some cases, when a plurality of colors required for the colorparameters are in this way).
color_palette () will accept any seaborn palette or color map of matplotlib name ( jetexcept, you should not use it). It can use any valid matplotlib format (RGB tuple, hexadecimal HTML color code or color name) specified list of colors. RGB return value is always a list of tuples.
Finally, no arguments invoked color_palette () returns the current default color cycle.
Corresponding function set_palette () using the same parameters, and set the default color for all cycles in FIG. You can also withuse the statement () color_palette to temporarily change the default color palette (see below).
If you do not understand the nature of the data, which is usually not possible to know the most appropriate color palette or color map a set of data. Next, we will use color_palette () and function in different ways other seaborn palette is divided into three general palette: Qualitative, Sequential, and diverging .
4.2 Qualitative
When you want to differentiate discrete data block has no inherent order, Qualitative (or classification) palette is the best.
When you import seaborn, the default color cycle changes to a group of ten colors to evoke the standard matplotlib color cycle, while designed to make the appearance more beautiful.
import seaborn as sns
import matplotlib.pyplot as plt

sns.set()
# default color cycle
current_palette = sns.color_palette()
sns.palplot(current_palette)
plt.show()