Table of contents
For more python information, source code, and tutorials, you can click the business card at the bottom of the article to get it and jump here
1. Detailed explanation of parameters
seaborn.heatmap()
seaborn.heatmap(data, vmin=None, vmax=None, cmap=None, center=None, robust=False, annot=None, fmt=‘.2g’, annotkws=None, linewidths=0, linecolor=‘white’, cbar=True, cbarkws=None, cbar_ax=None, square=False, ax=None, xticklabels=True, yticklabels=True, mask=None, **kwargs)
data:矩阵数据集,可以使numpy的数组(array),如果是pandas的dataframe,则df的index/column信息会分别对应到heatmap的columns和rows
vmax,vmin, 图例中最大值和最小值的显示值,没有该参数时默认不显示
linewidths,热力图矩阵之间的间隔大小
cmap,热力图颜色
ax,绘制图的坐标轴,否则使用当前活动的坐标轴。
annot,annotate的缩写,annot默认为False,当annot为True时,在heatmap中每个方格写入数据。
annot_kws,当annot为True时,可设置各个参数,包括大小,颜色,加粗,斜体字等:
sns.heatmap(x, annot=True, ax=ax2, annot_kws={

    'size':9,'weight':'bold', 'color':'blue'})
fmt,格式设置,决定annot注释的数字格式,小数点后几位等;
cbar : 是否画一个颜色条
cbar_kws : 颜色条的参数,关键字同 fig.colorbar,可以参考:matplotlib自定义colorbar颜色条-以及matplotlib中的内置色条。

mask,遮罩
- First use sns.set(font_scale) to modify the font scale:
sns.set(font_scale=1.5)
- Then use plt.rc to uniformly modify the font of the whole picture:
plt.rc('font',family='Times New Roman',size=12)
2. Color parameter -cmap
The parameters of cmap are as follows:
Accent, accent_r, blues_r, brbg, bug_r, bugn_r, bupu_r, cmrmap, cmrmap_r, DARK2_r, gnbu(绿到, Greys, Green, Green, Green, Greys, Greys, Greys, Greys, Greys, Grey色到Description), OrRd_r, Oranges, Oranges_r, PRGn, PRGn_r, Paired, Paired_r, Pastel1, Pastel1_r, Pastel2, Pastel2_r, PiYG, PiYG_r, PuBu, PuBuGn, PuBuGn_r, PuBu_r, PuOr, PuOr_r, PuRd, PuRd_r, Purples, Pur place_r , RdBu , RdBu_r, RdGy, RdGy_r, RdPu, RdPu_r, RdYlBu, RdYlBu_r, RdYlGn, RdYlGn_r, Reds, Reds_r, Set1, Set1_r, Set2, Set2_r, Set3, Set3_r, Spectral, Spectral_r, Wistia(interpretation).黄), Wistia_r, YlGn, YlGnBu, YlGnBu_r, YlGn_r, YlOrBr, YlOrBr_r, YlOrRd(红橙黄), YlOrRd_r, afmhot, afmhot_r, autumn, autumn_r, binary, binary_r, bone, bone_r, brg, brg_r, bwr, bwr_r, cividis, cividis_r, cool, cool_r, coolwarm(copper), coolwarm_r, copper(copper), copper_r, cubehelix, cubehelix_r, flag, flag_r, gist_earth, gist_earth_r,gist_gray, gist_gray_r, gist_heat, gist_heat_r, gist_ncar, gist_ncar_r, gist_rainbow, gist_rainbow_r, gist_stern, gist_stern_r, gist_yarg, gist_yarg_r, gnuplot, gnuplot2, gnuplot2_r, gnuplot_r, gray, gray_r, hot, hot_r(红黄), hsv, hsv_r, icefire, icefire_r, inferno, inferno_r, jet, jet_r, magma, magma_r, mako, mako_r, nipy_spectral, nipy_spectral_r, ocean, ocean_r, pink, pink_r, plasma, plasma_r, prism, prism_r, rainbow, rainbow_r, rocket, rocket_r, seismic, seismic_r, spring, spring_r, summer (黄到绿), summer_r (绿到黄), tab10, tab10_r, tab20, tab20_r, tab20b, tab20b_r, tab20c, tab20c_r, terrain, terrain_r, twilight, twilight_r, twilight_shifted, twilight_shifted_r, viridis, viridis_r,vlag, vlag_r, winter, winter_rgist_yarg_r, gnuplot, gnuplot2, gnuplot2_r, gnuplot_r, gray, gray_r, hot, hot_r(红黄), hsv, hsv_r, icefire, icefire_r, inferno, inferno_r, jet, jet_r, magma, magma_r, mako, mako_r, nipy_spectral, nipy_spectral_r, ocean, ocean_r, pink, pink_r, plasma, plasma_r, prism, prism_r, rainbow, rainbow_r, rocket, rocket_r, seismic, seismic_r, spring, spring_r, summer (黄到绿), summer_r (绿到黄), tab10, tab10_r, tab20, tab20_r, tab20b, tab20b_r, tab20c, tab20c_r, terrain, terrain_r, twilight, twilight_r, twilight_shifted, twilight_shifted_r, viridis, viridis_r,vlag, vlag_r, winter, winter_rgist_yarg_r, gnuplot, gnuplot2, gnuplot2_r, gnuplot_r, gray, gray_r, hot, hot_r(红黄), hsv, hsv_r, icefire, icefire_r, inferno, inferno_r, jet, jet_r, magma, magma_r, mako, mako_r, nipy_spectral, nipy_spectral_r, ocean, ocean_r, pink, pink_r, plasma, plasma_r, prism, prism_r, rainbow, rainbow_r, rocket, rocket_r, seismic, seismic_r, spring, spring_r, summer (黄到绿), summer_r (绿到黄), tab10, tab10_r, tab20, tab20_r, tab20b, tab20b_r, tab20c, tab20c_r, terrain, terrain_r, twilight, twilight_r, twilight_shifted, twilight_shifted_r, viridis, viridis_r,vlag, vlag_r, winter, winter_rrainbow_r, rocket, rocket_r, seismic, seismic_r, spring, spring_r, summer (黄到绿), summer_r (绿到黄), tab10, tab10_r, tab20, tab20_r, tab20b, tab20b_r, tab20c, tab20c_r, terrain, terrain_r, twilight, twilight_r, twilight_shifted, twilight_shifted_r, viridis, viridis_r,vlag, vlag_r, winter, winter_rrainbow_r, rocket, rocket_r, seismic, seismic_r, spring, spring_r, summer (黄到绿), summer_r (绿到黄), tab10, tab10_r, tab20, tab20_r, tab20b, tab20b_r, tab20c, tab20c_r, terrain, terrain_r, twilight, twilight_r, twilight_shifted, twilight_shifted_r, viridis, viridis_r,vlag, vlag_r, winter, winter_r
The demonstration is as follows:
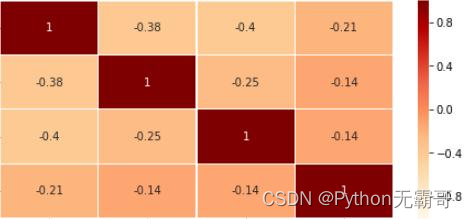
cmap="hot": yellow to red, the larger the number, the lighter the color

cmap="OrRd": deep red to light red, similar to "Oranges".
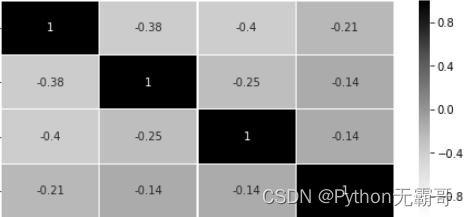
cmap="greys": gray
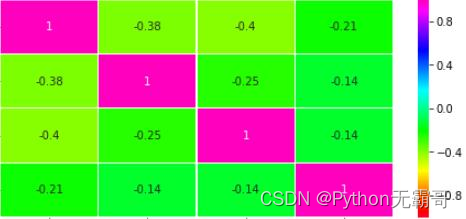
cmap="gist_rainbow": rainbow color
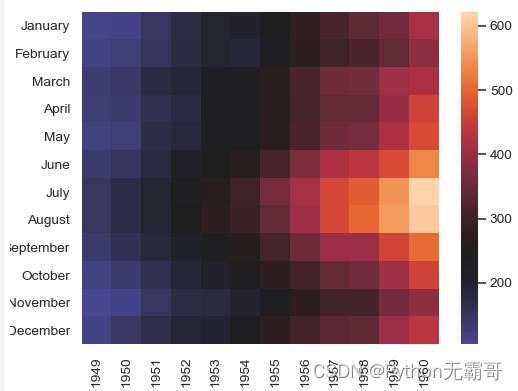
Center the colormap at a specific value (reference link):
>>> ax = sns.heatmap(flights, center=flights.loc["January", 1955])
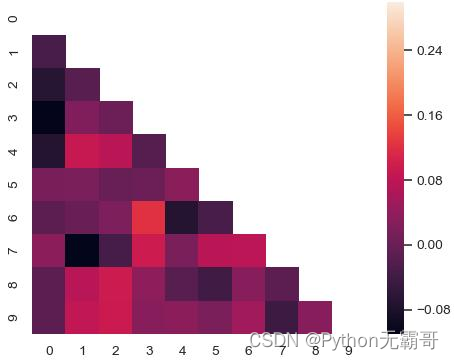
Draw a portion of a matrix using a mask
>>> corr = np.corrcoef(np.random.randn(10, 200))

>>> mask = np.zeros_like(corr)

>>> mask[np.triu_indices_from(mask)] = True

>>> with sns.axes_style("white"):

... ax = sns.heatmap(corr, mask=mask, vmax=.3, square=True)
np.zeros_like() returns an array of zeros with the same shape and type as the given array;
np.triu_indices_from(mask) Returns the indices of the triangles on the array.
The following are some good-looking pictures of color matching found on the Internet:
# cmap用cubehelix map颜色

cmap = sns.cubehelix_palette(start = 1.5, rot = 3, gamma=0.8, as_cmap = True)

sns.heatmap(pt, linewidths = 0.05, ax = ax1, vmax=900, vmin=0, cmap=cmap)

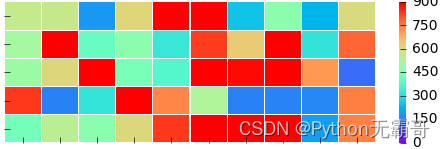
# cmap用matplotlib colormap

sns.heatmap(pt, linewidths = 0.05, ax = ax2, vmax=900, vmin=0, cmap='rainbow')
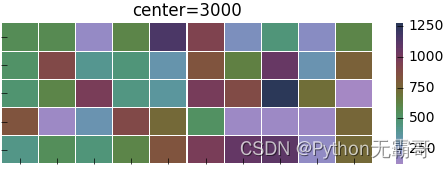
#center的用法(颜色)

f, (ax1,ax2) = plt.subplots(figsize = (6, 4),nrows=2)

cmap = sns.cubehelix_palette(start = 1.5, rot = 3, gamma=0.8, as_cmap = True)

sns.heatmap(pt, linewidths = 0.05, ax = ax1, cmap=cmap, center=None )
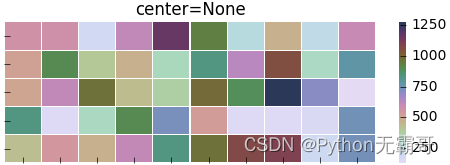
#设置x轴图例为空值ax1.set_ylabel('kind')

# 当center设置小于数据的均值时,生成的图片颜色要向0值代表的颜色一段偏移

sns.heatmap(pt, linewidths = 0.05, ax = ax2, cmap=cmap, center=200)
#robust的用法(颜色)

f, (ax1,ax2) = plt.subplots(figsize = (6,4),nrows=2)

cmap = sns.cubehelix_palette(start = 1.5, rot = 3, gamma=0.8, as_cmap = True)

sns.heatmap(pt, linewidths = 0.05, ax = ax1, cmap=cmap, center=None, robust=False )
sns.heatmap(pt, linewidths = 0.05, ax = ax2, cmap=cmap, center=None, robust=True )
#mask对某些矩阵块的显示进行覆盖

p2 = sns.heatmap(pt, ax=ax2, cmap=cmap, xticklabels=True, mask=(pt<800))

#mask对pt进行布尔型转化,结果为True的位置用白色覆盖

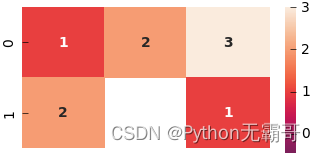
Realize with mask: highlight some data
sns.heatmap(x, mask=x < 1, ax=ax2, annot=True, annot_kws={“weight”: “bold”}) #cover the area less than 1
3. Personalized settings
Several ways to place the x-axis scale at the top position
# 将x轴刻度放置在top位置的几种方法

# ax.xaxis.set_ticks_position(‘top‘)

ax.xaxis.tick_top()

# ax.tick_params(axis=‘x‘,labelsize=6, colors=‘b‘, labeltop=True, labelbottom=False)
Set the scale parameters of the coordinate axis. When "axis" is not written, the default is to adjust the parameters of the x-axis and y-axis at the same time.
# 设置坐标轴刻度的字体大小

# matplotlib.axes.Axes.tick_params

ax.tick_params(axis=‘y‘,labelsize=8) # y轴
Two methods of text direction on rotation axis scale
# 旋转轴刻度上文字方向的两种方法

ax.set_xticklabels(ax.get_xticklabels(), rotation=-90)

# ax.set_xticklabels(corr.index, rotation=90)
4. Code
'''
深入挖掘
'''
font = {

    'family': 'Times New Roman',
        'size': 12,
        }
sns.set(font_scale=1.2)
plt.rc('font',family='Times New Roman')


fig = plt.figure(figsize = (16, 12))
ax1=fig.add_subplot(2,1,1)
cor = SubShowFeatures01.corr()
mask = np.zeros_like(cor)
for i in range(len(mask)):
    for j in range(i+1, len(mask[0])):
        mask[i][j] = True

sns.heatmap(cor,linewidths = 0.05, ax=ax1, mask=mask, annot=True, annot_kws=font, vmax=1.0, vmin=-1.0, cmap='YlGnBu', center=0.5,
            cbar=True, robust=False)
ax1.set_title('User metric features', fontdict=font)

ax2=fig.add_subplot(2,1,2)
SubShowFeatures02 = pd.DataFrame({

    "Label":FerFeatures.Label, "PEM":FerFeatures.PEM, "PVAL":FerFeatures.PVAL, "NVAL":FerFeatures.NVAL,
                            "NEM":FerFeatures.NEM, "DEP":FerFeatures.DEP, "AGR":FerFeatures.AGR, "CONV":FerFeatures.CONV,
                            "Cold":FerFeatures.Cold, "Warm":FerFeatures.Warm, "Pleasure":FerFeatures.Pleasure,
                            "Arousal":FerFeatures.Arousal, "Dominance":FerFeatures.Dominance
                           })
cor = SubShowFeatures02.corr()
mask = np.zeros_like(cor)
for i in range(len(mask)):
    for j in range(i+1, len(mask[0])):
        mask[i][j] = True
sns.heatmap(cor,linewidths = 0.05, ax=ax2, mask=mask, annot=True, annot_kws=font, vmax=1.0, vmin=-1.0, cmap='YlOrRd', center=0)
ax2.set_title('User personality features', fontdict=font)

plt.show()