numpy数组使你可以将许多数据处理任务表述为间接的数组表达式(否则需要编写循环)。用数组表达式代替循环的做法,通常被称为矢量化。一般来说,矢量化数组运算要比等价的纯python方式要快上一两个数量级(甚至更多),尤其是各种数值计算。
import numpy as np
points = np.arange(-5,5,0.01)
x,y = np.meshgrid(points,points)
y
array([[-5.  , -5.  , -5.  , ..., -5.  , -5.  , -5.  ],
       [-4.99, -4.99, -4.99, ..., -4.99, -4.99, -4.99],
       [-4.98, -4.98, -4.98, ..., -4.98, -4.98, -4.98],
       ...,
       [ 4.97,  4.97,  4.97, ...,  4.97,  4.97,  4.97],
       [ 4.98,  4.98,  4.98, ...,  4.98,  4.98,  4.98],
       [ 4.99,  4.99,  4.99, ...,  4.99,  4.99,  4.99]])
import matplotlib.pyplot as plt
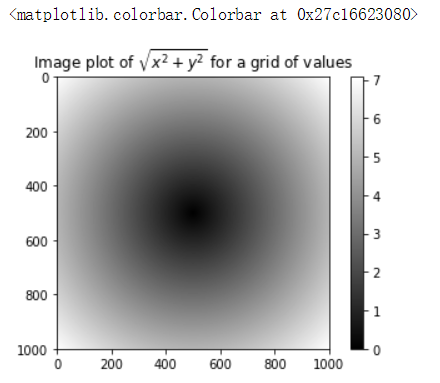
z = np.sqrt(x**2+y**2)
z
array([[7.07106781, 7.06400028, 7.05693985, ..., 7.04988652, 7.05693985,
        7.06400028],
       [7.06400028, 7.05692568, 7.04985815, ..., 7.04279774, 7.04985815,
        7.05692568],
       [7.05693985, 7.04985815, 7.04278354, ..., 7.03571603, 7.04278354,
        7.04985815],
       ...,
       [7.04988652, 7.04279774, 7.03571603, ..., 7.0286414 , 7.03571603,
        7.04279774],
       [7.05693985, 7.04985815, 7.04278354, ..., 7.03571603, 7.04278354,
        7.04985815],
       [7.06400028, 7.05692568, 7.04985815, ..., 7.04279774, 7.04985815,
        7.05692568]])
plt.title('Image plot of $\sqrt{x^2+y^2}$ for a grid of values')
plt.imshow(z,cmap=plt.cm.gray);plt.colorbar()