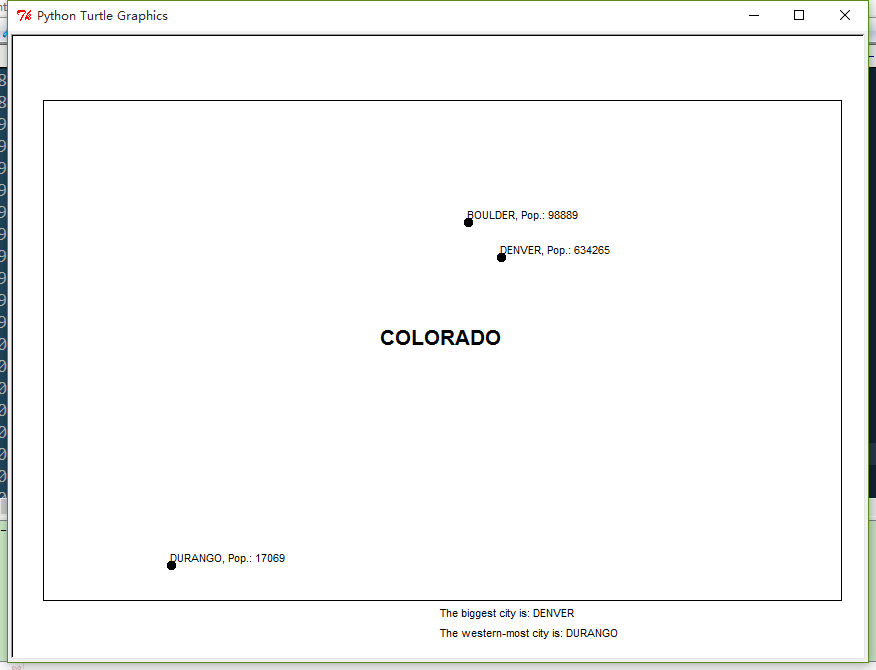
例子取自<<Learning Geospatial Analysis with Python>>
代码由两部分组成。第一部分是数据模型,第二部分是绘制数据(地图渲染)。
一、数据模型:使用python内置的列表(list),用来存储空间数据。
# DATA MODEL
# All layers will have a name, 1+ points, and population count
NAME = 0
POINTS = 1
POP = 2

# Create the state layer
state = ["COLORADO", [[-109, 37], [-109, 41], [-102, 41], [-102, 37]], 5187582]

# Cities layer list
# city = [name, [point], population]
cities = []

# Add Denver
cities.append(["DENVER",[-104.98, 39.74], 634265])
# Add Boulder
cities.append(["BOULDER",[-105.27, 40.02], 98889])
# Add Durango
cities.append(["DURANGO",[-107.88,37.28], 17069])使用python Turtle 绘图模块来渲染地图。其中有一个函数用来将世界坐标转换为像素坐标。
1、首先计算地图的显示范围及设定屏幕的绘制范围
# MAP GRAPHICS RENDERING
map_width = 800
map_height = 500

# State Bounding Box
# Use Python min/max function to get bounding box
minx = 180
maxx = -180
miny = 90
maxy = -90
for x,y in state[POINTS]:
  if x < minx: minx = x
  elif x > maxx: maxx = x
  if y < miny: miny = y
  elif y > maxy: maxy = y
# Get earth distance on each axis
dist_x = maxx - minx
dist_y = maxy - miny

# Scaling ratio each axis
# to map points from world to screen
x_ratio = map_width / dist_x
y_ratio = map_height / dist_y
# Function to convert lat/lon to screen coordinates
def convert(point):
  lon = point[0]
  lat = point[1]
  x = map_width - ((maxx - lon) * x_ratio)
  y = map_height - ((maxy - lat) * y_ratio)
  # Python turtle graphics start in the middle of the screen
  # so we must offset the points so they are centered
  x = x - (map_width/2)
  y = y - (map_height/2)
  return [x,y]
# Draw the state
t.up()
first_pixel = None
for point in state[POINTS]:
  pixel = convert(point)
  print pixel
  if not first_pixel:
    first_pixel = pixel
  t.goto(pixel)
  t.down()
# Go back to the first point
t.goto(first_pixel)
# Label the state
t.up()
t.goto([0,0])
t.write(state[NAME], align="center", font=("Arial",16,"bold"))

# Draw the cities
for city in cities:
  pixel = convert(city[POINTS])
  t.up()
  t.goto(pixel)
  # Place a point for the city
  t.dot(10)
  # Label the city
  t.write(city[NAME] + ", Pop.: " + str(city[POP]), align="left")
  t.up()

# Perform an attribute query
# Question: Which city has the largest population?
# Write the result but make sure it's under the map
biggest_city = max(cities, key=lambda city:city[POP])
t.goto(0, -1*((map_height/2)+20))
t.write("The biggest city is: " +  biggest_city[NAME])

# Perform a spatial query
# Question: Which is the western most city?
# Write the result but make sure it's under the other question
western_city = min(cities, key=lambda city:city[POINTS])
t.goto(0, -1*((map_height/2)+40))
t.write("The western-most city is: " + western_city[NAME])

# Hide our map pen
t.pen(shown=False)
t.done()
三、结果

